
 24.03.2023 10:01 AM
Technical Market Outlook:
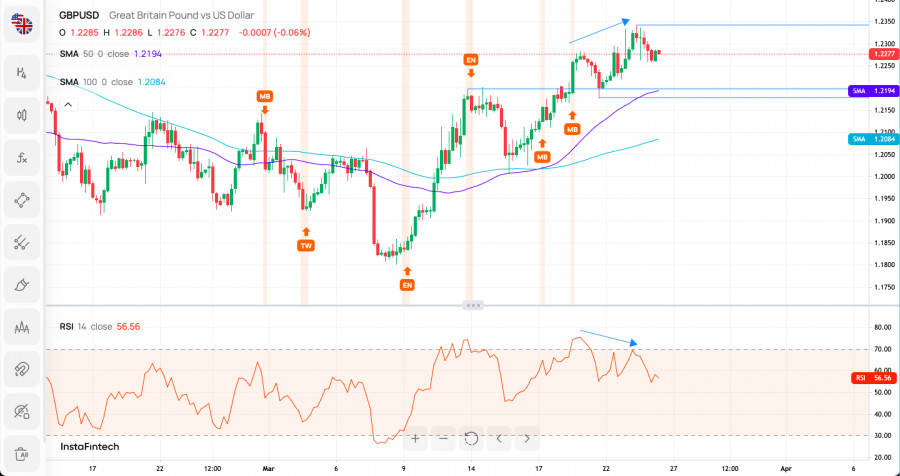
The GBP/USD pair has made a new swing high at the level of 1.2342 and pulled-back towards the level of 1.2260. The momentum is strong and positive, so the outlook remains bullish as the market conditions are not extremely overbought on the H4 time frame chart yet. In a case of a further extension to the upside, the next target for bulls is seen at the level of 1.2396 and 1.2447 (swing high). So far there is no indication of a potential up trend termination or reversal, so the short-term outlook remains bullish.
Weekly Pivot Points:
WR3 - 1.22458
WR2 - 1.22140
WR1 - 1.21963
Weekly Pivot - 1.21822
WS1 - 1.21645
WS2 - 1.21504
WS3 - 1.21186
Trading Outlook:
So far the level of 1.2443 was too strong resistance to break through, so a potential Double Top price pattern is still in play. Moreover, the level of 1.2297 which is 50% Fibonacci retracement level of the last big wave down had been hit, so the bears resumed the down trend. The down trend was confirmed with the level of 1.2089 breakout (50 WMA), so now the potential target for bears is seen at the level of 1.1840 or below.
You have already liked this post today
*The market analysis posted here is meant to increase your awareness, but not to give instructions to make a trade.
من المحتمل أن يتداول سعر المعدن الأصفر بين 3,203 وقد يصل إلى قاع القناة الهابطة حول 3,181 في الأيام القادمة، وهو مستوى يتزامن مع المتوسط المتحرك الأسي 200 عند 3,173
في وقت مبكر من الجلسة الأمريكية، يتداول زوج اليورو/الدولار الأمريكي حول 1.1378 داخل قناة الاتجاه الهابط التي تشكلت في 17 أبريل، ويظهر علامات على استنفاد القوة الصعودية. من المحتمل حدوث
روابط مفيدة: مقالاتي الأخرى متوفرة في هذا القسم دورة InstaForex للمبتدئين التحليلات الشائعة افتح حساب تداول مهم: يجب على المبتدئين في تداول الفوركس أن يكونوا حذرين للغاية عند اتخاذ قرارات
روابط مفيدة: مقالاتي الأخرى متوفرة في هذا القسم دورة InstaForex للمبتدئين التحليلات الشائعة افتح حساب تداول مهم: يجب على المبتدئين في تداول الفوركس أن يكونوا حذرين للغاية عند اتخاذ القرارات
مع ظهور نماذج الوتد المتسع المتباين والهابط على الرسم البياني لمدة 4 ساعات لزوج العملات المتقاطع AUD/JPY، على الرغم من أن حركة السعر تقع تحت المتوسط المتحرك الأسي (21) الذي
على الرسم البياني لمدة 4 ساعات للزوج الرئيسي USD/JPY، يمكن ملاحظة أن مؤشر Stochastic Oscillator يشكل نمط القاع المزدوج بينما يشكل حركة سعر USD/JPY قمة أعلى، مما يعطي هذا التباين
خطة التداول لدينا للساعات القادمة هي البيع تحت مستوى 1.1410 مع أهداف عند 1.1370 و1.1230. مؤشر النسر يعطي إشارة سلبية، لذلك نعتقد أن تصحيحًا تقنيًا قد يحدث على المدى القصير
Your IP address shows that you are currently located in the USA. If you are a resident of the United States, you are prohibited from using the services of InstaFintech Group including online trading, online transfers, deposit/withdrawal of funds, etc.
If you think you are seeing this message by mistake and your location is not the US, kindly proceed to the website. Otherwise, you must leave the website in order to comply with government restrictions.
Why does your IP address show your location as the USA?
Please confirm whether you are a US resident or not by clicking the relevant button below. If you choose the wrong option, being a US resident, you will not be able to open an account with InstaTrade anyway.
We are sorry for any inconvenience caused by this message.

