আরও দেখুন

 17.10.2024 10:26 AM
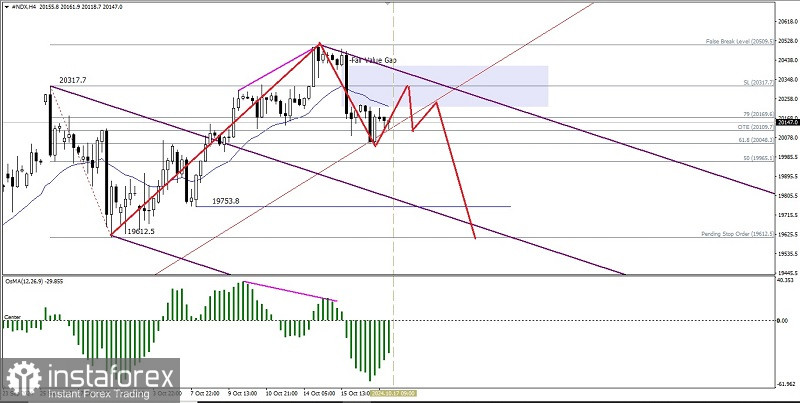
There are some interesting things on the 4-hour chart of the Nasdaq 100 Index, first the price movement of #NDX forms a bearish Pitchfork channel, second the price movement of the index is below the EMA 21 which also has a decreasing slope, third the appearance of deviations between the price movement of #NDX which forms Higher-High but on the contrary the MACD Histogram indicator (osMA) actually forms Higher-Low so that based on these facts it confirms that in the near future #NDX has the potential to weaken down where the level of 19965.1 will be tested to be broken if successful then #NDX will continue its weakening to the level of 19753.8 and 19612.5 as the next target if the momentum and volatility support but all weakening scenarios on #NDX will be canceled by themselves if on its way to these targets there is a sudden reversal where #NDX strengthens again until it breaks through and closes above the level of 20479.0.
(Disclaimer)
You have already liked this post today
*এখানে পোস্ট করা মার্কেট বিশ্লেষণ আপনার সচেতনতা বৃদ্ধির জন্য প্রদান করা হয়, ট্রেড করার নির্দেশনা প্রদানের জন্য প্রদান করা হয় না।


