আরও দেখুন


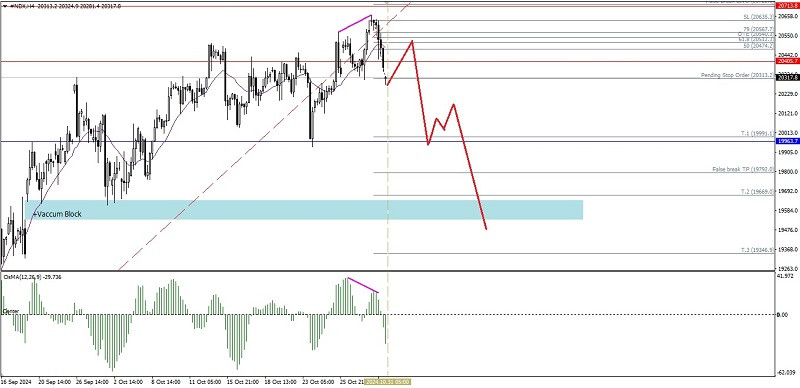
With the successful of the Nasdaq 100 index breaking through its Uptrendline and also confirmed by the appearance of deviations between price movements and the MACD Histogram indicator (osMA 12,26,9) and its price movement which is below the WMA (21) which also has a downward slope on its 4-hour chart, then in the near future #NDX has the potential to weaken down where the level of 19991.1 will be tested in the near future if it is successfully broken and closes below it, then #NDX has the potential to continue its weakening back to the level, but if on its way to the target levels, #NDX suddenly turns around and strengthens until it breaks and closes above the level of 20635.3, then all the weakening scenarios that have been described previously will become invalid and automatically canceled itself.
(Disclaimer)
You have already liked this post today
*এখানে পোস্ট করা মার্কেট বিশ্লেষণ আপনার সচেতনতা বৃদ্ধির জন্য প্রদান করা হয়, ট্রেড করার নির্দেশনা প্রদানের জন্য প্রদান করা হয় না।


