

অ্যাকচুয়াল প্যাটার্নস

প্যাটার্ন হলো গ্রাফিক্যাল মডেল, যা মূল্য ওঠানামার ভিত্তিতে চার্টে তৈরি হয়। টেকনিক্যাল বিশ্লেষণের নীতি অনুযায়ী, ইতিহাসের (প্রাইস মুভমেন্ট) পুনরাবৃত্তি ঘটে। অর্থাৎ, পরিস্থিতি যদি একই রকম থাকে তাহলে প্রাইস মুভমেন্টও প্রায় একই রকম হয়। এর ফলে মূল্যের ওঠানামা কেমন হবে তা আগেই থেকেই অনুমান করা যায়।
ইন্সটাফরেক্স এর প্রাসঙ্গিক প্যাটার্নসমূহ সহজেই ব্যবহার করা যায়, যার মাধ্যমে মার্কেটের সর্বশেষ পরিস্থিতি জানা যায় এবং তার উপর ভিত্তি করে সিদ্ধান্ত নেওয়া যায়। আমাদের সেবাগুলো থেকে আপনি যেকোনো পেয়ার এবং টাইমফ্রেমের জন্য সর্বশেষ এবং সবচেয়ে প্রাসঙ্গিক প্যাটার্নগুলো খুঁজে পাবেন।
Bearish Rectangle
was formed on 11.04 at 00:33:35 (UTC+0)
signal strength 1 of 5
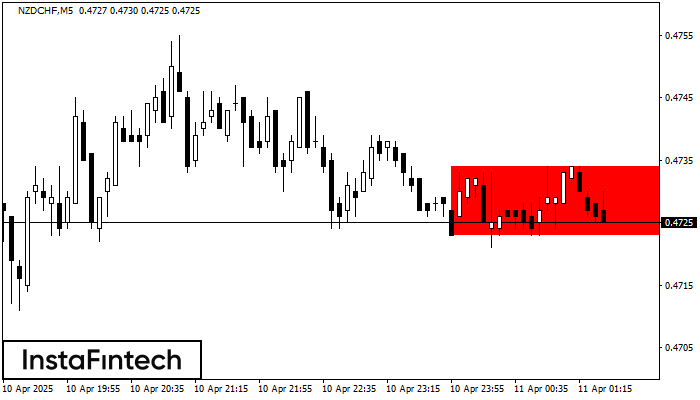
According to the chart of M5, NZDCHF formed the Bearish Rectangle. This type of a pattern indicates a trend continuation. It consists of two levels: resistance 0.4734 - 0.0000 and support 0.4723 – 0.4723. In case the resistance level 0.4723 - 0.4723 is broken, the instrument is likely to follow the bearish trend.
The M5 and M15 time frames may have more false entry points.
- All
- All
- Bearish Rectangle
- Bearish Symmetrical Triangle
- Bearish Symmetrical Triangle
- Bullish Rectangle
- Double Top
- Double Top
- Triple Bottom
- Triple Bottom
- Triple Top
- Triple Top
- All
- All
- Buy
- Sale
- All
- 1
- 2
- 3
- 4
- 5
বুলিশ সিমেট্রিকাল ট্রায়াঙ্গেল
was formed on 28.05 at 10:04:32 (UTC+0)
signal strength 2 of 5
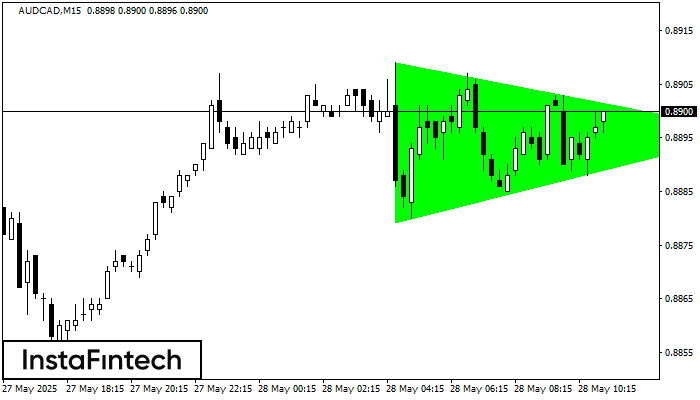
M15 চার্ট অনুযায়ী, AUDCAD বুলিশ সিমেট্রিকাল ট্রায়াঙ্গেল প্যাটার্ন গঠন করেছে। প্যাটার্নের নীচের সীমানা 0.8879/0.8896-এর কোঅর্ডিনেটগুলো স্পর্শ করেছে যেখানে উপরের সীমানাটি 0.8909/0.8896 জুড়ে যাচ্ছে৷ যদি বুলিশ সিমেট্রিকাল ট্রায়াঙ্গেল প্যাটার্নটি বজায় থাকে
M5 এবং M15 টাইম ফ্রেমে আরও ভুল এন্ট্রি পয়েন্ট থাকতে পারে।
Open chart in a new window
বিয়ারিশ পেন্যান্ট
was formed on 28.05 at 08:12:58 (UTC+0)
signal strength 1 of 5

M5 চার্টে GBPJPY-এর বিয়ারিশ পেন্যান্ট প্যাটার্ন গঠিত হয়েছে৷ এটি বিদ্যমান প্রবণতার সম্ভাব্য ধারাবাহিকতার ইঙ্গিত দেয়। স্পেসিফিকেশন: প্যাটার্নের নীচে 194.35 কোঅর্ডিনেশন রয়েছে; ফ্ল্যাগপোলের উচ্চতার প্রজেকশন 38 পিপসের সমান। যদি এই প্যাটার্নের
M5 এবং M15 টাইম ফ্রেমে আরও ভুল এন্ট্রি পয়েন্ট থাকতে পারে।
Open chart in a new window
বুলিশ সিমেট্রিকাল ট্রায়াঙ্গেল
was formed on 28.05 at 07:55:36 (UTC+0)
signal strength 1 of 5

M5 চার্ট অনুসারে, GBPAUD বুলিশ সিমেট্রিকাল ট্রায়াঙ্গেল প্যাটার্ন গঠন করেছে, যা চলমান প্রবণতা অব্যাহত থাকবে বলে ইঙ্গিত দিচ্ছে। বর্ণনা: প্যাটার্নের উপরের সীমানা 2.0988/2.0939-এর কোঅর্ডিনেটগুলো স্পর্শ করেছে যেখানে নীচের সীমানা 2.0903/2.0939
M5 এবং M15 টাইম ফ্রেমে আরও ভুল এন্ট্রি পয়েন্ট থাকতে পারে।
Open chart in a new window


