

অ্যাকচুয়াল প্যাটার্নস

প্যাটার্ন হলো গ্রাফিক্যাল মডেল, যা মূল্য ওঠানামার ভিত্তিতে চার্টে তৈরি হয়। টেকনিক্যাল বিশ্লেষণের নীতি অনুযায়ী, ইতিহাসের (প্রাইস মুভমেন্ট) পুনরাবৃত্তি ঘটে। অর্থাৎ, পরিস্থিতি যদি একই রকম থাকে তাহলে প্রাইস মুভমেন্টও প্রায় একই রকম হয়। এর ফলে মূল্যের ওঠানামা কেমন হবে তা আগেই থেকেই অনুমান করা যায়।
ইন্সটাফরেক্স এর প্রাসঙ্গিক প্যাটার্নসমূহ সহজেই ব্যবহার করা যায়, যার মাধ্যমে মার্কেটের সর্বশেষ পরিস্থিতি জানা যায় এবং তার উপর ভিত্তি করে সিদ্ধান্ত নেওয়া যায়। আমাদের সেবাগুলো থেকে আপনি যেকোনো পেয়ার এবং টাইমফ্রেমের জন্য সর্বশেষ এবং সবচেয়ে প্রাসঙ্গিক প্যাটার্নগুলো খুঁজে পাবেন।
Bearish pennant
was formed on 16.04 at 16:37:14 (UTC+0)
signal strength 2 of 5
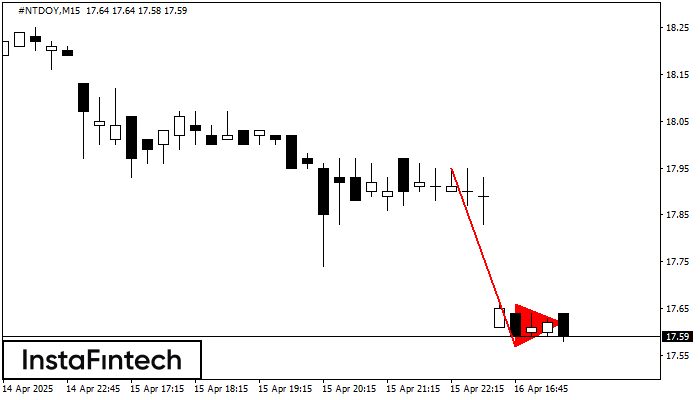
The Bearish pennant pattern has formed on the #NTDOY M15 chart. It signals potential continuation of the existing trend. Specifications: the pattern’s bottom has the coordinate of 17.57; the projection of the flagpole height is equal to 38 pips. In case the price breaks out the pattern’s bottom of 17.57, the downtrend is expected to continue for further level 17.34.
The M5 and M15 time frames may have more false entry points.
- All
- All
- Bearish Rectangle
- Bearish Symmetrical Triangle
- Bearish Symmetrical Triangle
- Bullish Rectangle
- Double Top
- Double Top
- Triple Bottom
- Triple Bottom
- Triple Top
- Triple Top
- All
- All
- Buy
- Sale
- All
- 1
- 2
- 3
- 4
- 5
Triple Bottom
сформирован 29.05 в 23:30:14 (UTC+0)
сила сигнала 2 из 5
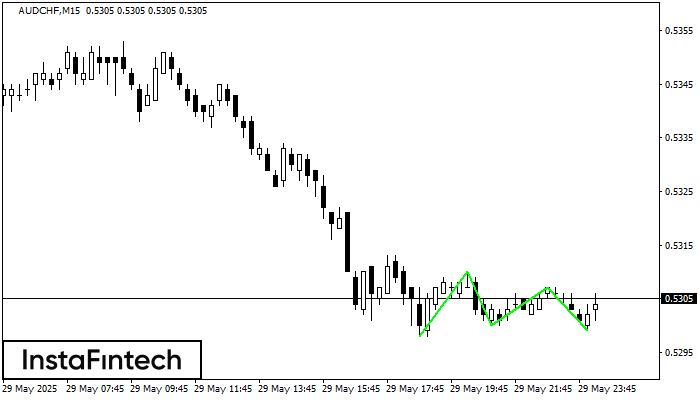
The Triple Bottom pattern has formed on the chart of AUDCHF M15. Features of the pattern: The lower line of the pattern has coordinates 0.5310 with the upper limit 0.5310/0.5307
The M5 and M15 time frames may have more false entry points.
Открыть график инструмента в новом окне
Bullish Rectangle
сформирован 29.05 в 23:04:26 (UTC+0)
сила сигнала 5 из 5
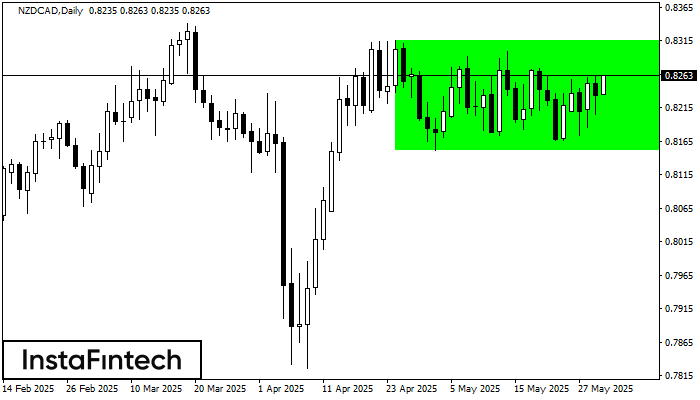
According to the chart of D1, NZDCAD formed the Bullish Rectangle. The pattern indicates a trend continuation. The upper border is 0.8316, the lower border is 0.8151. The signal means
Открыть график инструмента в новом окне
Bearish Symmetrical Triangle
сформирован 29.05 в 22:19:03 (UTC+0)
сила сигнала 1 из 5
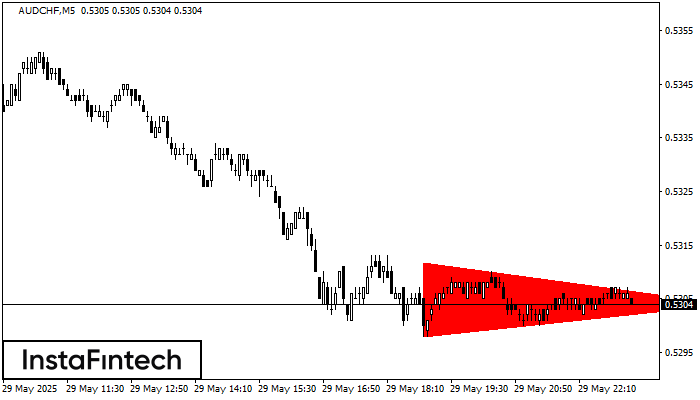
According to the chart of M5, AUDCHF formed the Bearish Symmetrical Triangle pattern. Trading recommendations: A breach of the lower border 0.5298 is likely to encourage a continuation
The M5 and M15 time frames may have more false entry points.
Открыть график инструмента в новом окне


