See also


 03.04.2024 01:41 PM
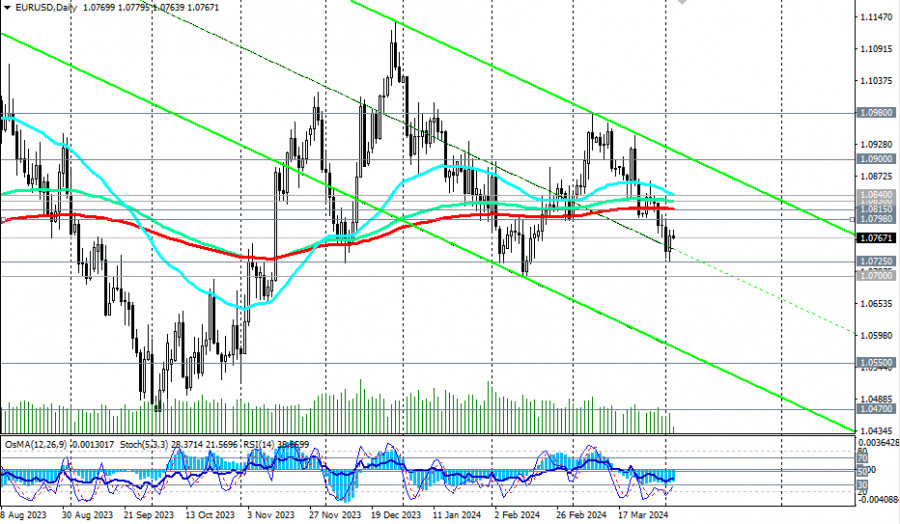
EUR/USD dropped into the zone of the medium-term bearish market after breaking through the zone of key support levels at 1.0840 (50 EMA on the daily chart), 1.0830 (144 EMA on the daily chart), and 1.0815 (200 EMA on the daily chart).
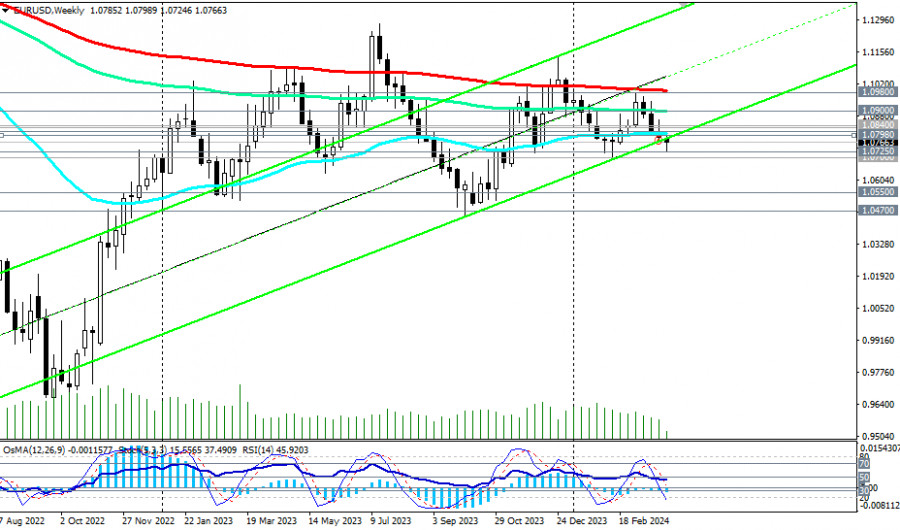
With the breakthrough of the important support levels at 1.0805 (50 EMA on the weekly chart) and 1.0775 (lower line of the upward channel on the weekly chart), the pair also "declared its intention" for further decline into the territory of the long-term bearish market, located below the key resistance levels at 1.0900 (144 EMA on the weekly chart), 1.0980 (200 EMA on the weekly chart).
At the same time, technical indicators RSI, OsMA, and Stochastic on the daily and weekly charts are on the sellers' side, also signaling the advantage of short positions.
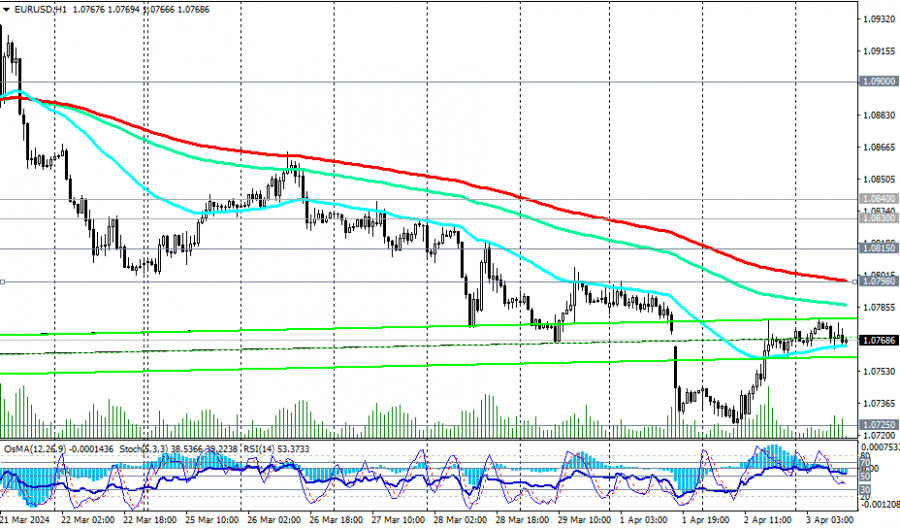
Therefore, in the current situation, preference should be given to short positions on EUR/USD. However, a breakthrough of today's low at 1.0764 may become the very first signal for new positions.
The nearest downward targets are located at local support levels 1.0725 and 1.0700. Their breakthrough will open the way for EUR/USD to decline towards the lower boundary of the downward channel on the daily chart and levels 1.0550, 1.0500, and 1.0470.
In an alternative scenario, the first signal for the resumption of long positions may be a breakthrough of the important short-term resistance level at 1.0798 (200 EMA on the 1-hour chart). Furthermore, a breakthrough of the zone of key resistance levels at 1.0815, 1.0830, and 1.0840 will bring EUR/USD into the territory of the medium-term bullish market, making long positions preferable again with targets near key resistance levels at 1.0900, 1.0980, 1.1000.
Trading Scenarios
Main Scenario: Sell Stop 1.0755. Stop-Loss 1.0805. Targets 1.0725, 1.0700, 1.0660, 1.0600, 1.0550, 1.0500, 1.0470, 1.0400, 1.0300
Alternative Scenario: Buy Stop 1.0845. Stop-Loss 1.0790. Targets 1.0900, 1.0920, 1.0980, 1.1000, 1.1040, 1.1090, 1.1100, 1.1140, 1.1200, 1.1275, 1.1300, 1.1400, 1.1500
"Targets" correspond to support/resistance levels. This also does not mean that they will necessarily be reached, but they can serve as a guideline for planning and placing trading positions.
You have already liked this post today
*The market analysis posted here is meant to increase your awareness, but not to give instructions to make a trade.
Analysis of Thursday's Trades 1H Chart of GBP/USD The GBP/USD pair didn't even attempt a correction on Thursday. While the euro faced bearish pressure from weak business activity indices
Analysis of Thursday's Trades 1H Chart of EUR/USD On Thursday, the EUR/USD currency pair corrected to the nearest support level on the hourly timeframe, which was at 1.1267. Multiple factors
The GBP/USD currency pair broke out of its sideways channel through the upper boundary, but it is in no hurry to continue rising. Traders appear to be gathering momentum
On Thursday, the EUR/USD currency pair traded lower, which can be considered an exception to the general trend. Nearly all macroeconomic reports during the day were unfavorable for the euro
Analysis of Wednesday's Trades 1H Chart of GBP/USD The GBP/USD pair maintained its upward trend on Wednesday, a movement that has developed over the past two weeks. Recall that
Analysis of Wednesday's Trades 1H Chart of EUR/USD On Wednesday, the EUR/USD currency pair continued its upward movement calmly and steadily. The price broke through the 1.1267 level, which
The GBP/USD currency pair also resumed its upward movement on Wednesday. The rise of the British pound, which in reality still reflects the fall of the US dollar, began overnight
The EUR/USD currency pair resumed its upward movement on Wednesday, and it is now safe to say that the uptrend is present not only in the hourly timeframe but also
Analysis of Tuesday's Trades 1H Chart of GBP/USD The GBP/USD pair mainly traded sideways on Tuesday, but early Wednesday morning it surged upward. On the 4-hour timeframe, it's clear that
Analysis of Tuesday's Trades 1H Chart of EUR/USD On Tuesday, the EUR/USD currency pair traded sideways, but it resumed its upward movement early Wednesday morning. This indicates that the ongoing
InstaTrade
PAMM accounts

Your IP address shows that you are currently located in the USA. If you are a resident of the United States, you are prohibited from using the services of InstaFintech Group including online trading, online transfers, deposit/withdrawal of funds, etc.
If you think you are seeing this message by mistake and your location is not the US, kindly proceed to the website. Otherwise, you must leave the website in order to comply with government restrictions.
Why does your IP address show your location as the USA?
Please confirm whether you are a US resident or not by clicking the relevant button below. If you choose the wrong option, being a US resident, you will not be able to open an account with InstaTrade anyway.
We are sorry for any inconvenience caused by this message.


