See also


 27.12.2024 12:33 AM
The outcomes of the December Federal Reserve meeting resulted in a significant strengthening of the dollar, leading to a decrease in demand for gold and silver. Precious metals are considered safe-haven assets, but they do not generate investment income. When global central banks, especially the Federal Reserve, maintain a tight monetary policy or signal expectations of further tightening, the demand for these assets tends to decline.
Despite this, the upward trend in gold prices remains intact. It is likely that the multi-year bullish trend will continue, although it may not be as pronounced as in previous months.
Performance Review
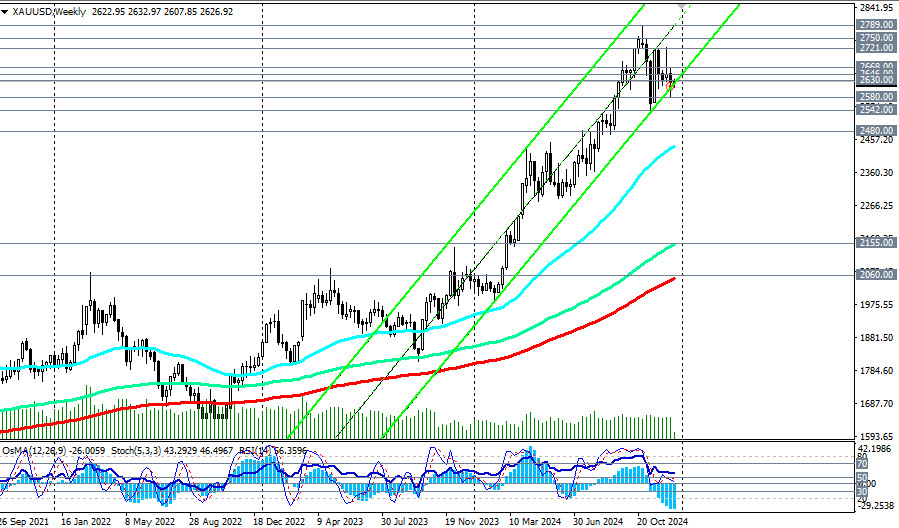
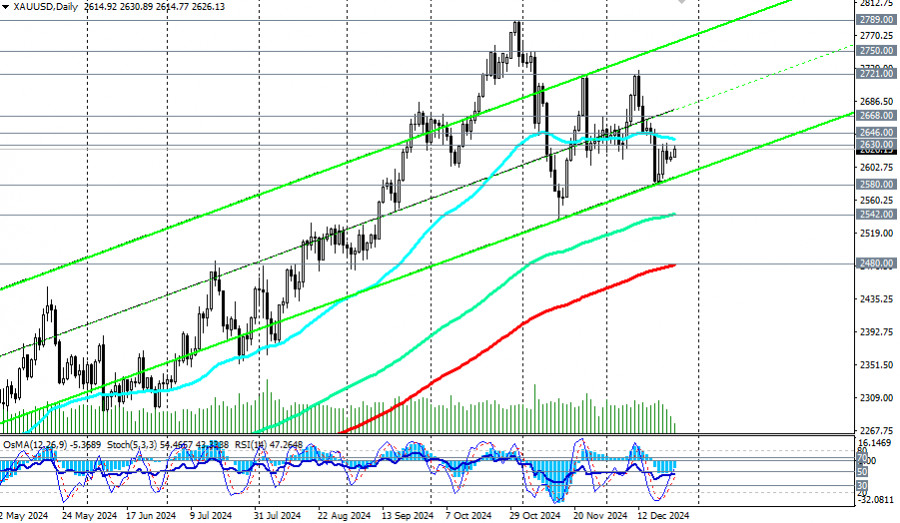
Over the past month, XAU/USD has lost approximately 3.5%, briefly dropping to mid-September lows around 2537.00. However, it has maintained its long-term bullish momentum and rebounded, although it has not yet surpassed the record high of 2790.00 reached at the end of October.
Since then, the price has settled into a range mostly confined between 2721.00 and 2580.00.
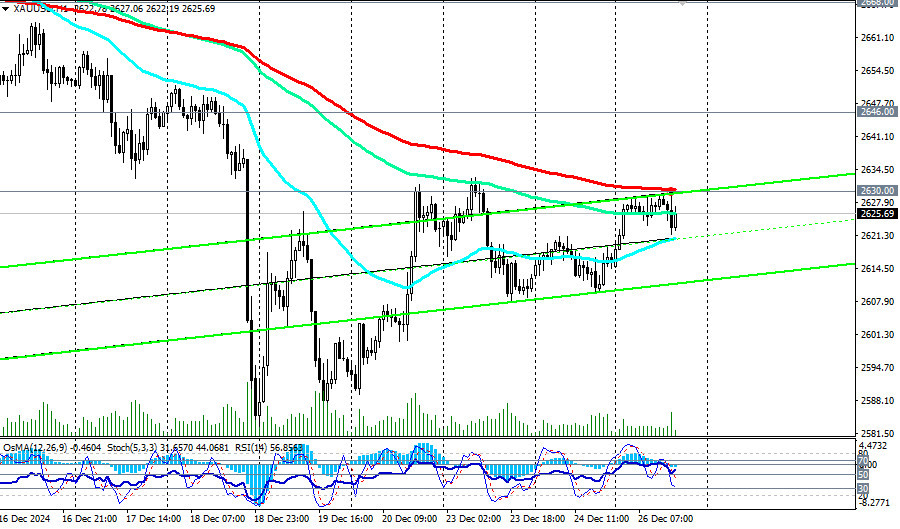
As of this writing, the XAU/USD pair is trading near 2630.00 and is testing a key short-term resistance level indicated by the 200-period moving average on the hourly chart.
A breakout above this level, along with the resistance at 2646.00 (the 200-period EMA on the 4-hour chart), would indicate a full return of the price to the medium-term bullish zone and within the ascending channel on the daily chart. This movement could drive the price toward the upper boundary of the channel, which lies between 2750.00 and 2790.00.
This area is likely to become a target in the coming weeks or even months.
Alternative Scenario
In an alternative scenario, a decline signal may occur if the support at 2620.00 is broken, followed by a breach of local support at 2608.00. The nearest targets are the support zones at 2580.00 and 2542.00 (the 144-period EMA on the daily chart).
It is unlikely that we will see a deeper decline into the zone below the key medium-term support level at 2480.00 (the 200-period EMA on the daily chart). Overall, XAU/USD remains in the bullish zone.
The advantage remains with long-term buy positions.
Support Levels: 2620.00, 2608.00, 2600.00, 2580.00, 2542.00, 2500.00, 2480.00Resistance Levels: 2630.00, 2646.00, 2668.00, 2700.00, 2721.00, 2750.00, 2790.00, 2800.00, 2900.00, 3000.00
Primary Scenario:
Alternative Scenario:
*) Targets correspond to support/resistance levels. While these levels may not always be reached, they can serve as useful benchmarks for planning and executing trading strategies.
You have already liked this post today
*The market analysis posted here is meant to increase your awareness, but not to give instructions to make a trade.
Analysis of Tuesday's Trades 1H Chart of GBP/USD On Tuesday, the GBP/USD pair also traded lower for the same reasons as the EUR/USD pair. First, after a conversation with Ursula
Analysis of Tuesday's Trades 1H Chart of EUR/USD On Tuesday, the EUR/USD currency pair continued its downward movement, which had begun on Monday. The dollar continued to strengthen the night
On Tuesday, the GBP/USD currency pair also traded lower for the same reasons as the EUR/USD pair. However, it cannot be said that the British currency depreciated significantly—an upward movement
The EUR/USD currency pair showed a somewhat significant downward movement on Tuesday. However, this move did not impact the overall trend, market sentiment, or the broader context. The strengthening
In my morning forecast, I highlighted the 1.1374 level and planned to make trading decisions based on it. Let's look at the 5-minute chart to analyze what happened. A decline
The GBP/USD currency pair also traded higher on Monday, although it pulled back slightly during the day. This retreat followed the announcement that the increase in tariffs for the European
On Monday, the EUR/USD currency pair initially rose following Trump's announcement that tariffs on EU goods would increase to 50% starting June 1. However, the pair subsequently fell after Trump
Your IP address shows that you are currently located in the USA. If you are a resident of the United States, you are prohibited from using the services of InstaFintech Group including online trading, online transfers, deposit/withdrawal of funds, etc.
If you think you are seeing this message by mistake and your location is not the US, kindly proceed to the website. Otherwise, you must leave the website in order to comply with government restrictions.
Why does your IP address show your location as the USA?
Please confirm whether you are a US resident or not by clicking the relevant button below. If you choose the wrong option, being a US resident, you will not be able to open an account with InstaTrade anyway.
We are sorry for any inconvenience caused by this message.


