See also


 02.04.2025 04:00 AM
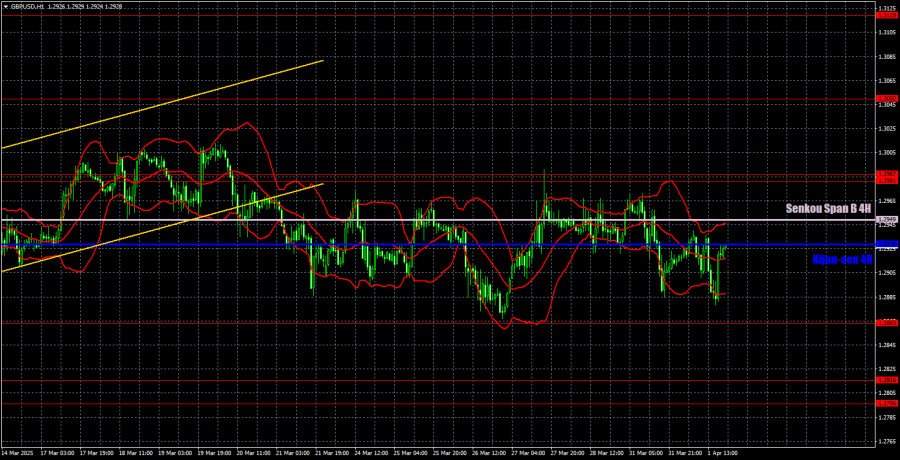
The GBP/USD currency pair continued to trade similarly on Tuesday, as it has over the last few weeks. All price movements have occurred between 1.2863 and 1.2981 for the past two weeks. The Ichimoku indicator lines are being ignored during this flat phase. The macroeconomic background is irrelevant as the price continues to move sideways. The current technical situation for the pound is highly favorable. Of course, the market reacts to individual reports, but such movements are practically pointless to trade.
Yesterday, the UK published its March manufacturing PMI. The figure dropped to 44.9 points, while the market expected 44.6. So, how should this report be interpreted? Business activity declined again, but not as sharply as expected... Still, there's little positive news coming out of the UK. In the U.S., aside from the ISM index, the JOLTs job openings report was released, which also had no impact. Job openings in February amounted to 7.568 million, below market expectations. So, both U.S. reports underperformed—just like the only one from the UK.
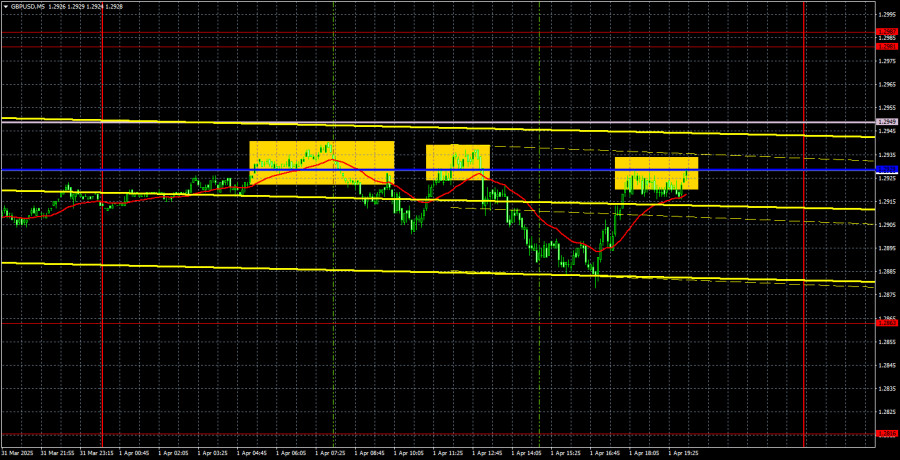
In the 5-minute timeframe, the price bounced off the Kijun-sen line three times on Tuesday. All three signals were inaccurate. Since the flat range is visible even from a mile away on the hourly chart, we believe it made no sense to open short positions based on these signals. In a flat market, trading off the range boundaries is viable. But the pair doesn't seem willing to reach those boundaries. Notably, all three signals provided at least a minor move in the correct direction, so incurring losses would have been complex.
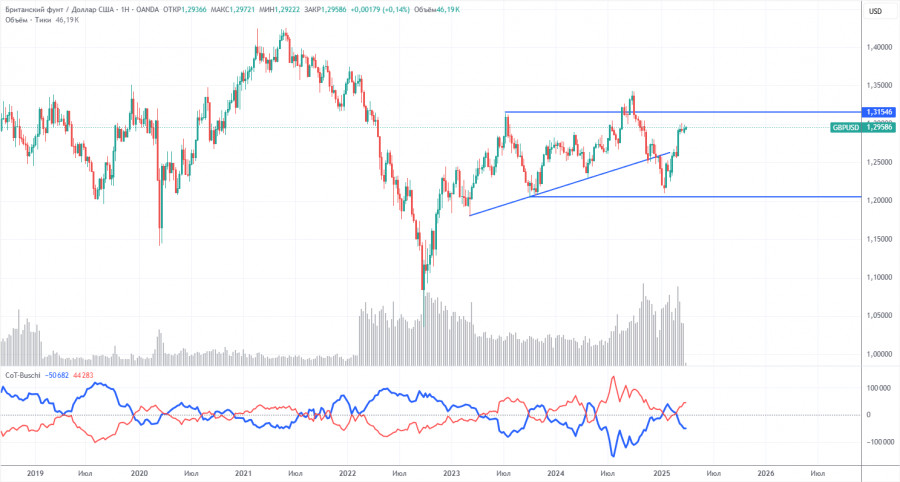
The COT reports for the British pound show that commercial traders' sentiment has constantly shifted in recent years. The red and blue lines, which reflect the net positions of commercial and non-commercial traders, frequently cross and usually stay close to the zero line. They are again near each other, indicating a roughly equal number of long and short positions.
On the weekly timeframe, the price first broke through the 1.3154 level and then dropped to the trendline, which it successfully breached. Breaking the trendline suggests a high probability of further GBP decline. However, the bounce from the previous local low on the weekly timeframe is also worth noting. We may be looking at a broad flat.
According to the latest COT report for the British pound, the "Non-commercial" group opened 13,000 new long contracts and closed 1,800 short contracts. As a result, the net position of non-commercial traders rose again—by 14,800 contracts.
The fundamental background still provides no grounds for long-term GBP purchases, and the currency remains vulnerable to continuing the global downtrend. The pound has risen significantly recently, and the primary reason for this increase is Donald Trump's policy.
On the hourly chart, GBP/USD remains completely flat. The upward correction on the daily chart has long overstayed. We still don't see any substantial justification for a long-term GBP rally. The only supportive factor is Donald Trump, who continues to announce sanctions and tariffs left and right. However, even this factor has started to lose its impact on the market. Therefore, we must wait for the flat to end and then determine a new trend on the hourly chart.
For April 2, the following levels are highlighted for trading: 1.2331–1.2349, 1.2429–1.2445, 1.2511, 1.2605–1.2620, 1.2691–1.2701, 1.2796–1.2816, 1.2863, 1.2981–1.2987, 1.3050, 1.3119. The Senkou Span B (1.2949) and Kijun-sen (1.2929) lines may also be signal sources. Moving your Stop Loss to breakeven if the price moves 20 pips in the right direction is recommended. Ichimoku lines may shift throughout the day, which must be considered when determining trading signals.
On Wednesday, the UK's economic calendar is empty, and the only U.S. report will be the ADP employment change, which may trigger a slight intraday reaction but is unlikely to have a long-term effect. Donald Trump may announce new tariffs overnight, which is notable. However, it's worth remembering that the last tariff announcement from the U.S. president caused virtually no market reaction.
You have already liked this post today
*The market analysis posted here is meant to increase your awareness, but not to give instructions to make a trade.
Analysis of Thursday's Trades 1H Chart of GBP/USD The GBP/USD pair continued to trade higher throughout Thursday. Even at its peak levels, the British pound shows no intention of correcting
Analysis of Thursday's Trades 1H Chart of EUR/USD The EUR/USD currency pair continued trading within a sideways channel on Thursday, as shown on the hourly timeframe chart above. The current
The GBP/USD currency pair continued its upward movement on Thursday, trading near multi-year highs. Despite the lack of significant events in the U.S. or the U.K. (unlike Wednesday), the market
The EUR/USD currency pair continued to trade sideways on Thursday. While previously it had been moving within a range between 1.1274 and 1.1391, on Thursday, it was stuck
In my morning forecast, I highlighted the 1.3247 level as a reference point for market entry decisions. Let's take a look at the 5-minute chart and analyze what happened
In my morning forecast, I highlighted the 1.1341 level as a key point for market entry decisions. Let's take a look at the 5-minute chart and analyze what happened there
Analysis of Tuesday's Trades 1H Chart of GBP/USD Throughout Tuesday, the GBP/USD pair continued its upward movement. As we can see, the British currency doesn't need any particular reason
Analysis of Tuesday's Trades 1H Chart of EUR/USD On Tuesday, the EUR/USD currency pair pulled back slightly, which can be considered a purely technical correction. Yesterday — and generally —
InstaTrade
PAMM accounts

Your IP address shows that you are currently located in the USA. If you are a resident of the United States, you are prohibited from using the services of InstaFintech Group including online trading, online transfers, deposit/withdrawal of funds, etc.
If you think you are seeing this message by mistake and your location is not the US, kindly proceed to the website. Otherwise, you must leave the website in order to comply with government restrictions.
Why does your IP address show your location as the USA?
Please confirm whether you are a US resident or not by clicking the relevant button below. If you choose the wrong option, being a US resident, you will not be able to open an account with InstaTrade anyway.
We are sorry for any inconvenience caused by this message.


