See also


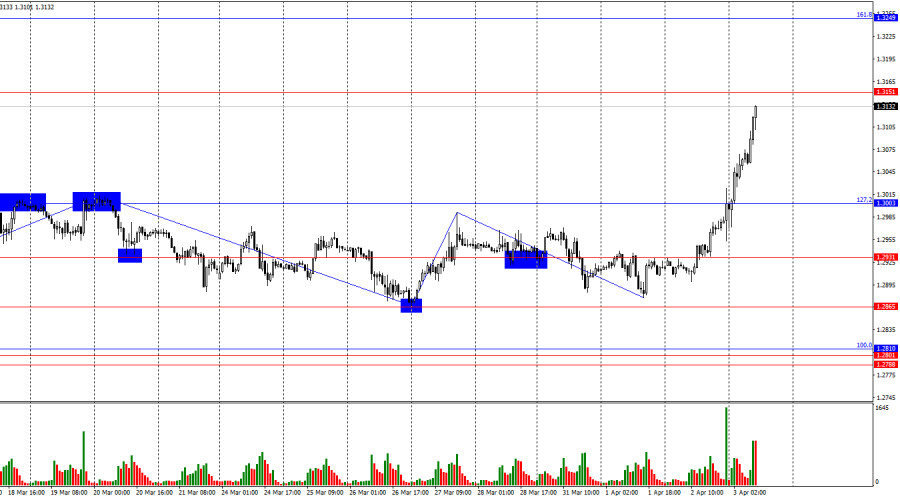
The last completed downward wave failed to break the previous low, while the new upward wave easily surpassed the previous peak. Thus, a bullish trend is currently unfolding. Most traders still refuse to buy the dollar regardless of the economic data because Donald Trump keeps introducing new tariffs, which are expected to hit U.S. and global economic growth in the future. For the bullish trend to turn bearish, the pair must consolidate below 1.2865.
The news background for the pound on Wednesday was the same as for the euro. As a result, both pairs showed strong gains, which are still ongoing. By tomorrow, the euro and the pound could rise another 100–150 points, similar to what we saw in early March. I originally intended to say that Friday would be very important for the dollar—but now I don't see the point. The dollar once again plummeted thanks to Donald Trump, making reports like Nonfarm Payrolls, the unemployment rate, and even Jerome Powell's speech practically irrelevant. These could only make matters worse. If the Fed Chair starts talking about a slowing economy, recession, or labor market challenges—and the market senses the Fed is preparing for rate cuts—it will only further sink the dollar. And if the NFP or unemployment figures come in worse than expected, the dollar could collapse by another hundred points. In my view, yesterday's tariffs are not Trump's final "gift" to the dollar.
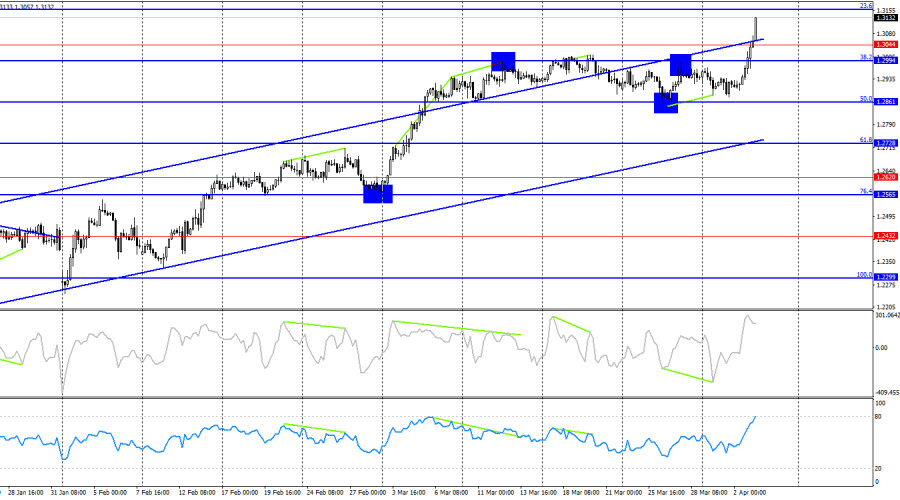
On the 4-hour chart, the pair retains its bullish trend. I don't expect a strong decline in the pound unless the price closes below the rising channel. A rebound from the 23.6% Fibonacci level at 1.3157 could favor the dollar, but honestly, the dollar doesn't stand much of a chance right now. A bullish divergence in the CCI indicator signaled a potential rise, though that wasn't the cause of the rally—it was simply a side note.
Commitments of Traders (COT) Report:
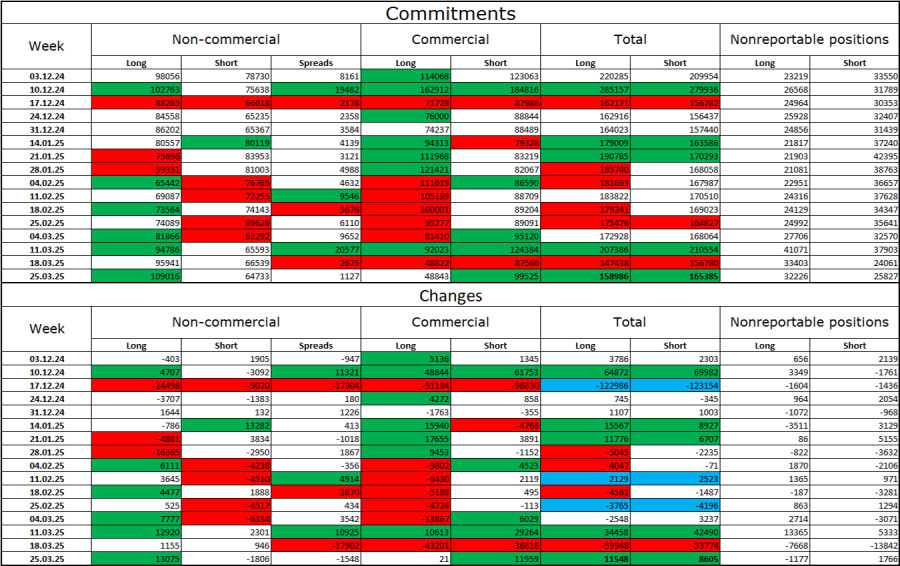
The sentiment among "Non-commercial" traders became more bullish last week. The number of long positions held by speculators rose by 13,075, while short positions decreased by 1,806. Bears have lost their market advantage. The gap between long and short positions is now nearly 44,000 in favor of the bulls: 109,000 vs. 65,000.
In my opinion, the pound still has downward potential, but recent events may lead the market to shift in the long term. Over the past three months, long positions have grown from 98,000 to 109,000, while shorts dropped from 78,000 to 65,000. More significantly, over the past eight weeks, longs increased from 59,000 to 109,000, and shorts decreased from 81,000 to 65,000. Let me remind you—those are "eight weeks of Trump's rule."
Friday's calendar contains several key events, but for today, the only major item is the U.S. ISM Services PMI. Still, I believe none of these supposedly critical reports will matter for the dollar at this stage. They may influence sentiment slightly, but that's about it.
GBP/USD Forecast and Trader Tips:
I wouldn't recommend selling the pair amid this strong rally. Of course, the dollar won't fall forever, but right now it's even hard to identify levels from which a decline might start. Buying is an option if the price consolidates above 1.3003 on the hourly chart, targeting 1.3151 and 1.3249.
Fibonacci levels are drawn from 1.2809 to 1.2100 on the hourly chart and from 1.2299 to 1.3432 on the 4-hour chart.
You have already liked this post today
*The market analysis posted here is meant to increase your awareness, but not to give instructions to make a trade.


Ferrari F8 TRIBUTO
from InstaTrade
InstaTrade
PAMM accounts

Your IP address shows that you are currently located in the USA. If you are a resident of the United States, you are prohibited from using the services of InstaFintech Group including online trading, online transfers, deposit/withdrawal of funds, etc.
If you think you are seeing this message by mistake and your location is not the US, kindly proceed to the website. Otherwise, you must leave the website in order to comply with government restrictions.
Why does your IP address show your location as the USA?
Please confirm whether you are a US resident or not by clicking the relevant button below. If you choose the wrong option, being a US resident, you will not be able to open an account with InstaTrade anyway.
We are sorry for any inconvenience caused by this message.


