See also


 10.04.2025 05:08 AM
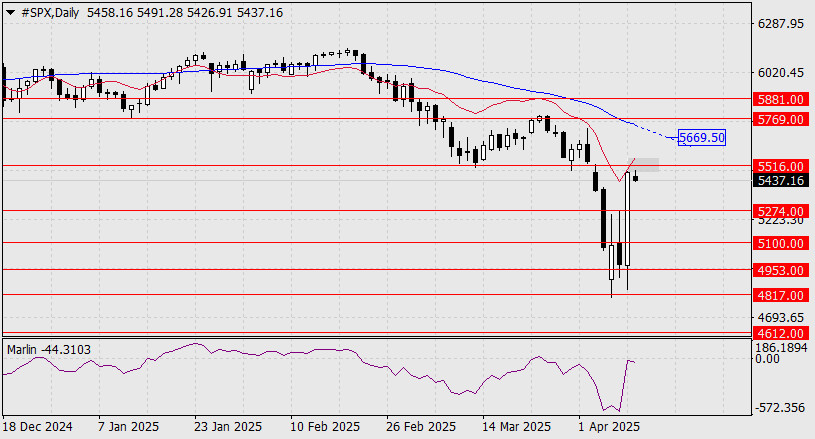
The U.S. stock index, the S&P 500, posted one of the largest single-day gains in its history yesterday. It fell just a few points short of the target level at 5516.00. There's also the subtle question of whether the April 2–3 gap has been fully closed. If the market senses something is incomplete, it may linger for another day or two within the gray rectangle marked on the daily chart. A critical resistance level is the MACD line around 5669.50. A breakout above it could resume the medium-term uptrend, potentially pushing the index to new all-time highs.
However, our main scenario anticipates a reversal, with the price pulling back to support at 4612.00—the July 2023 peak. The Marlin oscillator also turns down from the zero line, supporting this outlook. The reasoning is that among the 75 countries Trump announced tariff reductions for (down to the base 10%) yesterday, none are the U.S.'s primary trading partners.
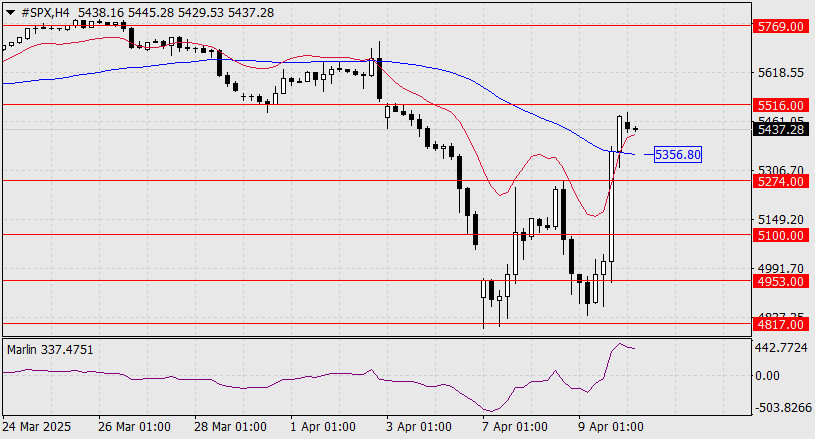
On the 4-hour timeframe, the price remains above the MACD line, which allows for a more precise test of 5516.00, perhaps even overshooting it. However, a break below the MACD line and 5356.00 could open the way to 5274.00, and a close below that would confirm the reversal scenario.
You have already liked this post today
*The market analysis posted here is meant to increase your awareness, but not to give instructions to make a trade.
Useful links: My other articles are available in this section InstaForex course for beginners Popular Analytics Open trading account Important: The begginers in forex trading need to be very careful
Early in the American session, gold is trading around 3,384, above key support and rebounding after reaching 3,267. Gold is expected to regain strength if it consolidates above 3,381 (6/8
Useful links: My other articles are available in this section InstaForex course for beginners Popular Analytics Open trading account Important: The begginers in forex trading need to be very careful
With the appearance of Divergent and Descending Broadening Wedge patterns on the 4-hour chart of the AUD/JPY cross currency pair, although its price movement is below the EMA (21) which
On the 4-hour chart of the main currency pair USD/JPY, it can be seen that the Stochastic Oscillator indicator forms a Double Bottom pattern while the price movement of USD/JPY
Early in the American session, gold is trading around the 3,310 level, where it is located at the 21SMA and within a symmetrical triangle pattern formed on April 23. Consolidation
Our trading plan for the coming hours is to sell below 1.1410 with targets at 1.1370 and 1.1230. The eagle indicator is giving a negative signal, so we believe
Useful links: My other articles are available in this section InstaForex course for beginners Popular Analytics Open trading account Important: The begginers in forex trading need to be very careful
The Eagle indicator is showing oversold signals, so we believe that gold could resume its bullish cycle in the short term after a technical correction and reach the psychological level
InstaTrade
video analytics

Your IP address shows that you are currently located in the USA. If you are a resident of the United States, you are prohibited from using the services of InstaFintech Group including online trading, online transfers, deposit/withdrawal of funds, etc.
If you think you are seeing this message by mistake and your location is not the US, kindly proceed to the website. Otherwise, you must leave the website in order to comply with government restrictions.
Why does your IP address show your location as the USA?
Please confirm whether you are a US resident or not by clicking the relevant button below. If you choose the wrong option, being a US resident, you will not be able to open an account with InstaTrade anyway.
We are sorry for any inconvenience caused by this message.


