See also


 10.04.2025 06:49 AM
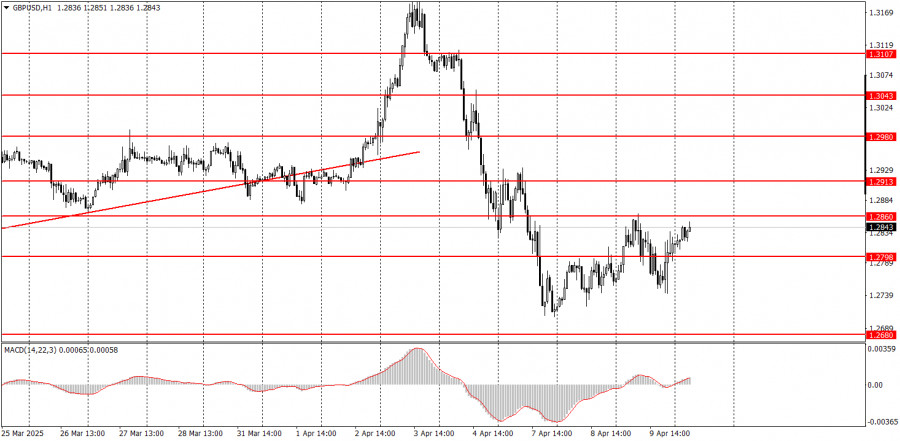
The GBP/USD pair spent the past 24 hours rising, then falling again, and then rising again. As before, it's impossible to identify a clear trend on the hourly timeframe. News about the progress of the trade war is released every hour or two, market sentiment shifts constantly, and the pair is being thrown back and forth. The pound is rising at the moment, but it could be falling again in an hour.
Donald Trump's grace period changes virtually nothing. Sure, three months can be used for negotiations to avoid a full-scale trade conflict with many countries. However, the key trading partners are Mexico, Canada, the EU, China, Japan, and South Korea. So far, there's no realistic chance of reaching an amicable agreement with Canada, the EU, or China. And in any case, "reciprocal tariffs" remain in effect—just now at 10%. Therefore, the dollar has gained no strong new reasons to rally over the past day.
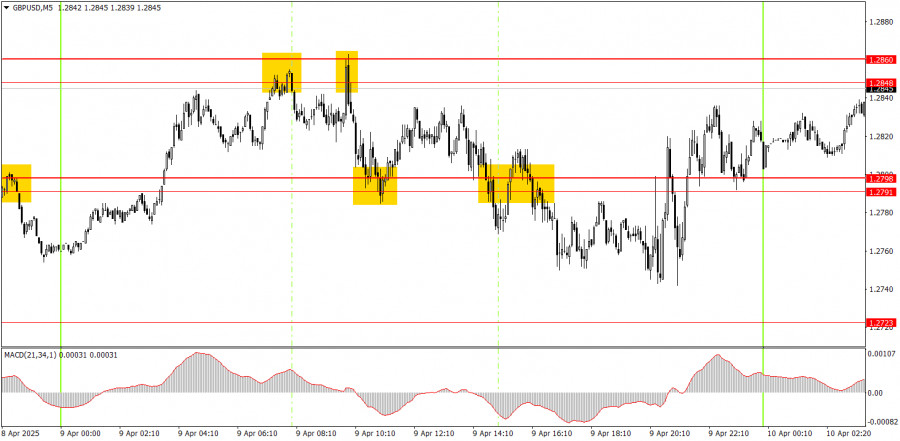
On the 5-minute timeframe, several signals were formed on Wednesday. However, as noted, market sentiment kept shifting, and the price frequently reversed direction. The first two sell signals in the 1.2848–1.2860 area could be traded confidently. The next signal of the 1.2791–1.2798 zone was also valid. Then the U.S. session opened, Trump woke up, and chaos resumed.
In the hourly timeframe, the GBP/USD pair should have started a downward trend long ago, but Trump has kept doing everything he can to push the dollar down. Since the official start of the global trade war, we don't attempt to predict long-term price movements. Last Friday, we saw a sharp drop in the pair, which may be the beginning of a deeper correction. Still, the market remains under the influence of Trump and his decisions: Trump announces new tariffs – the dollar falls; Trump offers discounts – and the dollar bounces.
On Thursday, GBP/USD may remain in turmoil. Predicting the pound and dollar's direction today is nearly impossible. At this point, the pair is rising naturally, and today's U.S. inflation report could also impact price movements.
On the 5-minute chart, trading is currently possible around the following levels: 1.2502–1.2508, 1.2547, 1.2613, 1.2680–1.2685, 1.2723, 1.2791–1.2798, 1.2848–1.2860, 1.2913, 1.2980–1.2993, 1.3043, 1.3102–1.3107, 1.3145–1.3167, 1.3225, 1.3272.
No significant events are scheduled in the UK on Thursday, but the U.S. inflation report will be released. While not as crucial as it once was, it shouldn't be ignored.
Support and Resistance Levels: These are target levels for opening or closing positions and can also serve as points for placing Take Profit orders.
Red Lines: Channels or trendlines indicating the current trend and the preferred direction for trading.
MACD Indicator (14,22,3): A histogram and signal line used as a supplementary source of trading signals.
Important Events and Reports: Found in the economic calendar, these can heavily influence price movements. Exercise caution or exit the market during their release to avoid sharp reversals.
Forex trading beginners should remember that not every trade will be profitable. Developing a clear strategy and practicing proper money management are essential for long-term trading success.
You have already liked this post today
*The market analysis posted here is meant to increase your awareness, but not to give instructions to make a trade.
Analysis of Wednesday's Trades 1H Chart of GBP/USD The GBP/USD pair showed no notable movements on Wednesday. After Jerome Powell stated the need for more time to assess the full
Analysis of Wednesday's Trades 1H Chart of EUR/USD The EUR/USD currency pair continued to trade within the sideways channel on Wednesday, which is visible on the hourly timeframe
On Wednesday, the GBP/USD currency pair continued trading within a sideways channel, clearly visible on the hourly timeframe. There was virtually no movement throughout the day, and no fundamental
On Wednesday, the EUR/USD currency pair continued to trade in the same flat range. The 1.1274 and 1.1426 levels bound the broader sideways channel, while the narrower channel ranges between
In my morning forecast, I highlighted the 1.1379 level and planned to base market entry decisions around it. Let's look at the 5-minute chart to understand what happened. A rise
Analysis of Tuesday's Trades 1H Chart of GBP/USD The GBP/USD pair exhibited a notable upward movement on Tuesday, although it remains within a sideways channel that may not be immediately
Analysis of Tuesday's Trades 1H Chart of EUR/USD On Tuesday, the EUR/USD currency pair traded completely flat. Throughout the day, there were no significant reports or events either
Ferrari F8 TRIBUTO
from InstaTrade
Forex Chart
Web-version

Your IP address shows that you are currently located in the USA. If you are a resident of the United States, you are prohibited from using the services of InstaFintech Group including online trading, online transfers, deposit/withdrawal of funds, etc.
If you think you are seeing this message by mistake and your location is not the US, kindly proceed to the website. Otherwise, you must leave the website in order to comply with government restrictions.
Why does your IP address show your location as the USA?
Please confirm whether you are a US resident or not by clicking the relevant button below. If you choose the wrong option, being a US resident, you will not be able to open an account with InstaTrade anyway.
We are sorry for any inconvenience caused by this message.


