Actual patterns

Patterns are graphical models which are formed in the chart by the price. According to one of the technical analysis postulates, history (price movement) repeats itself. It means that the price movements are often similar in the same situations which makes it possible to predict the further development of the situation with a high probability.
Relevant patterns by InstaTrade is an easy-to-use service which allows you to be aware of latest changes in the market and react to clues from the market in time. In our service you will always find the latest and most relevant patterns on any pair and any timeframe.
Double Top
was formed on 17.04 at 19:15:19 (UTC+0)
signal strength 1 of 5
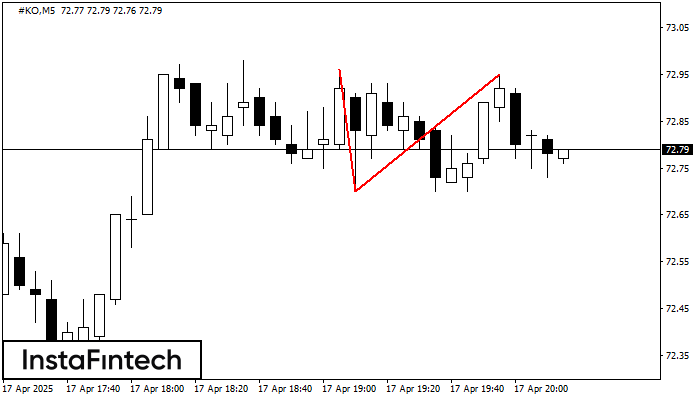
On the chart of #KO M5 the Double Top reversal pattern has been formed. Characteristics: the upper boundary 72.95; the lower boundary 72.70; the width of the pattern 25 points. The signal: a break of the lower boundary will cause continuation of the downward trend targeting the 72.55 level.
The M5 and M15 time frames may have more false entry points.
See Also
- All
- All
- Bearish Rectangle
- Bearish Symmetrical Triangle
- Bearish Symmetrical Triangle
- Bullish Rectangle
- Double Top
- Double Top
- Triple Bottom
- Triple Bottom
- Triple Top
- Triple Top
- All
- All
- Buy
- Sale
- All
- 1
- 2
- 3
- 4
- 5
รูปแบบสามเหลี่ยมสมมาตรขาลง (Bearish Symmetrical Triangle)
was formed on 29.05 at 22:19:03 (UTC+0)
signal strength 1 of 5
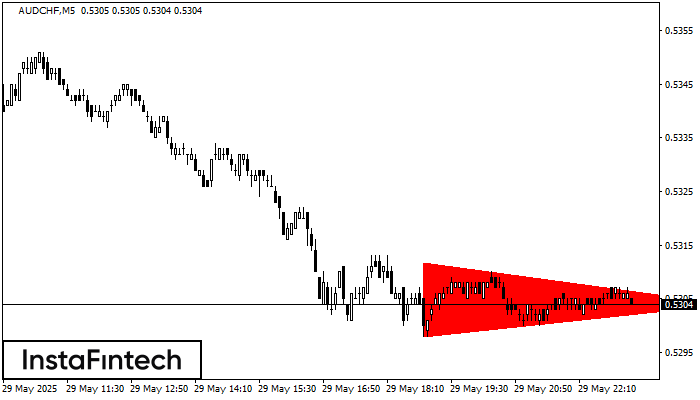
อ้างอิงจากชาร์ตของ M5, AUDCHF ที่ได้สร้างรูปแบบ รูปแบบสามเหลี่ยมสมมาตรขาลง (Bearish Symmetrical Triangle) ออกมา สำหรับคำแนะนำการซื้อขาย คือ การเคลื่อนตัวทะลุผ่านขอบเขตในด้านล่าง 0.5298 อาจจะช่วยสนับสนุนต่อแนวโน้มขาลงอย่างต่อเนื่อง
ขอบเตระยะเวลาใน M5 และ M15 อาจจะมีตำแหน่งการเข้าใช้งานที่ผิดพลาดมากยิ่งขึ้น
Open chart in a new window
รูปแบบกราฟธงขาขึ้น (Bullish Flag)
was formed on 29.05 at 22:16:27 (UTC+0)
signal strength 3 of 5
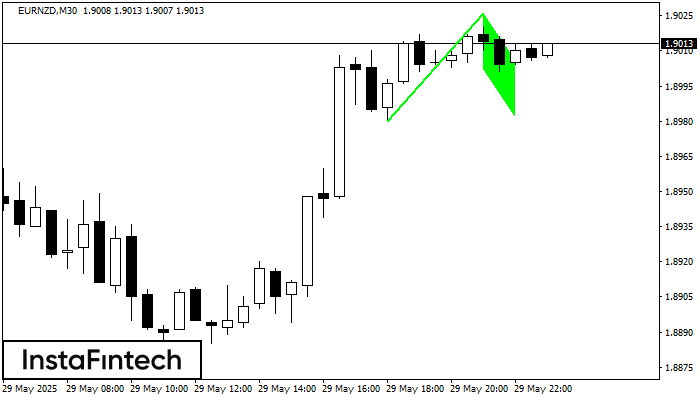
รูปแบบ รูปแบบกราฟธงขาขึ้น (Bullish Flag) ซึ่งแสดงถึงความต่อเนื่องของแนวโน้ม ได้สร้างขึ้นมาในชาร์ต EURNZD M30 การคาดการณ์: ถ้าราคาเคลื่อนตัวทะลุผ่านสูงกว่าระดับสูงของกราฟรูปแบบนี้ที่ 1.9026 จากนั้นเทรดเดอร์จะสามารถกำหนดสัญญาการซื้อ โดยมีเป้าหมายอยู่ที่ 1.9056
Open chart in a new window
รูปแบบกราฟธงปลายแหลมขาขึ้น (Bullish pennant)
was formed on 29.05 at 22:16:23 (UTC+0)
signal strength 3 of 5
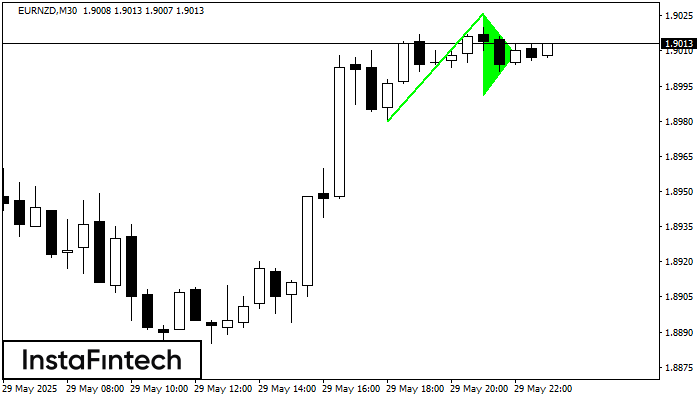
รูปแบบกราฟิก รูปแบบกราฟธงปลายแหลมขาขึ้น (Bullish pennant) ได้สร้างขึ้นมาในตราสาร EURNZD M30 รูปแบบประเภทนี้จะอยู่ใน ประเภทของรูปแบบต่อเนื่อง ในกรณีเช่นนี้ ถ้าหากมูลค่าสามารถเคลื่อนตัวทะลุผ่านระดับสูงออกไปได้ ก็คาดการณ์ว่าจะยังเคลื่อนตัวไปยังแนวโน้มขาขึ้นที่ระดับ 1.9056
Open chart in a new window