Lihat juga


 22.03.2023 09:18 AM
Technical Market Outlook:
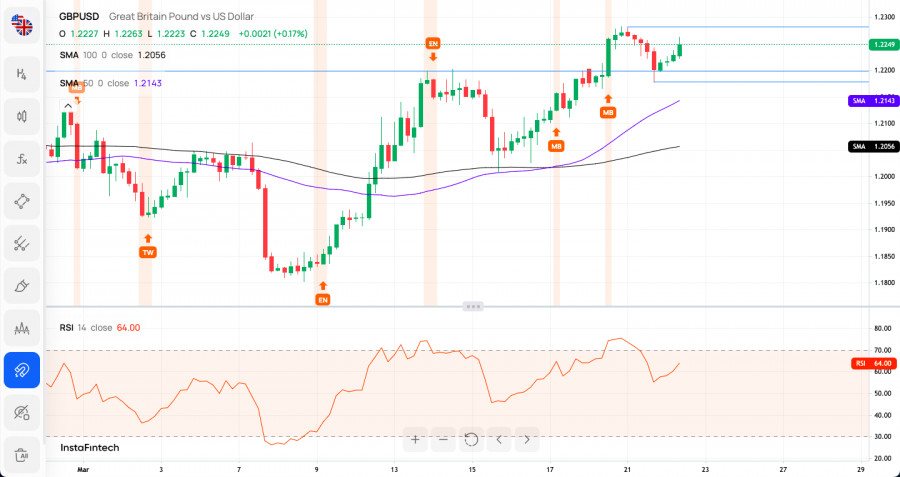
The GBP/USD pair has made a new swing high at the level of 1.2283 and then the bears started the pull-back. Currently, the pull-back is done with a low at the level of 1.2178 and just ahead of the UK CPI data release the bulls are trying to resume the up trend. The momentum is strong and positive, so the outlook remains bullish as the market conditions are not extremely overbought on the H4 time frame chart anymore. In a case of a further extension to the upside, the next target for bulls is seen at the level of 1.2396 and 1.2447 (swing high).
Weekly Pivot Points:
WR3 - 1.22458
WR2 - 1.22140
WR1 - 1.21963
Weekly Pivot - 1.21822
WS1 - 1.21645
WS2 - 1.21504
WS3 - 1.21186
Trading Outlook:
So far the level of 1.2443 was too strong resistance to break through, so a potential Double Top price pattern is still in play. Moreover, the level of 1.2297 which is 50% Fibonacci retracement level of the last big wave down had been hit, so the bears resumed the down trend. The down trend was confirmed with the level of 1.2089 breakout (50 WMA), so now the potential target for bears is seen at the level of 1.1840 or below.
You have already liked this post today
*Analisis pasar yang diposting disini dimaksudkan untuk meningkatkan pengetahuan Anda namun tidak untuk memberi instruksi trading.
Dari apa yang nampak di chart 4 jamnya pada indeks Nasdaq 100, terlihat indikator Stochastic Oscillator berada dalam kondisi Crossing SELL serta munculnya pola Rising Wedge sehingga berdasarkan dua kondisi
Dengan munculnya Divergent serta pola Descending Broadening Wedge pada chart 4 jam dari pasangan mata uang silang AUD/JPY, meski pergerakan harganya berada dibawah EMA (21) memiliki kemiringan yang menurun, namun
Pada chart 4 jamnya pasangan mata uang utama USD/JPY nampak terlihat kalau indikator Stochastic Oscillator membentuk pola Double Bottom sedangkan pergerakan harga dari USD/JPY membentuk Higher High sehingga Divergent
Pada chart 4 jam dari pasangan mata uang utama USD/JPY, nampak terlihat kalau indikator Stochastic Oscillator membentuk pola Double Bottom sedangkan pergerakan harga dari USD/JPY membentuk Higher High sehingga Divergent
Pada awal sesi Amerika, emas diperdagangkan di sekitar level 3.310, yang terletak di SMA 21 dalam pola triangle simetris yang terbentuk pada 23 April. Konsolidasi kemungkinan akan terbentuk dalam beberapa
Rencana trading kami untuk beberapa jam ke depan adalah menjual di bawah 1.1410 dengan target di 1.1370 dan 1.1230. Indikator eagle memberikan sinyal negatif, jadi kami percaya koreksi teknis dapat
Pada chart 4 jamnya instrumen komoditi Minyak Mentah nampak terlihat bergerak dibawah WMA (21) yang juga memiliki kemiringan slope yang menurun dimana ini berarti saat ini Seller tengah mendominasi
Bila Kita perhatikan chart 4 jam pasangan mata uang silang GBP/JPY nampak terlihat dua hal yang menarik pertama munculnya pola Rising Wedge, kedua terdapat Divergent antara pergerakan harga GBP/JPY dengan
Di sisi lain, jika tekanan bearish mendominasi dan euro terkonsolidasi di bawah 1.1370, ini dapat dianggap sebagai sinyal jual dengan target di 6/8 Murray yang terletak di 1.1230 dan akhirnya
Pada sesi Amerika awal, emas diperdagangkan di sekitar 3.299 dalam channel tren menurun yang terbentuk sejak 21 April, menunjukkan pemulihan di atas support pada 3.270. Pada grafik H4, kita dapat
InstaTrade dalam angka

Your IP address shows that you are currently located in the USA. If you are a resident of the United States, you are prohibited from using the services of InstaFintech Group including online trading, online transfers, deposit/withdrawal of funds, etc.
If you think you are seeing this message by mistake and your location is not the US, kindly proceed to the website. Otherwise, you must leave the website in order to comply with government restrictions.
Why does your IP address show your location as the USA?
Please confirm whether you are a US resident or not by clicking the relevant button below. If you choose the wrong option, being a US resident, you will not be able to open an account with InstaTrade anyway.
We are sorry for any inconvenience caused by this message.

