Lihat juga


 04.04.2025 09:38 AM
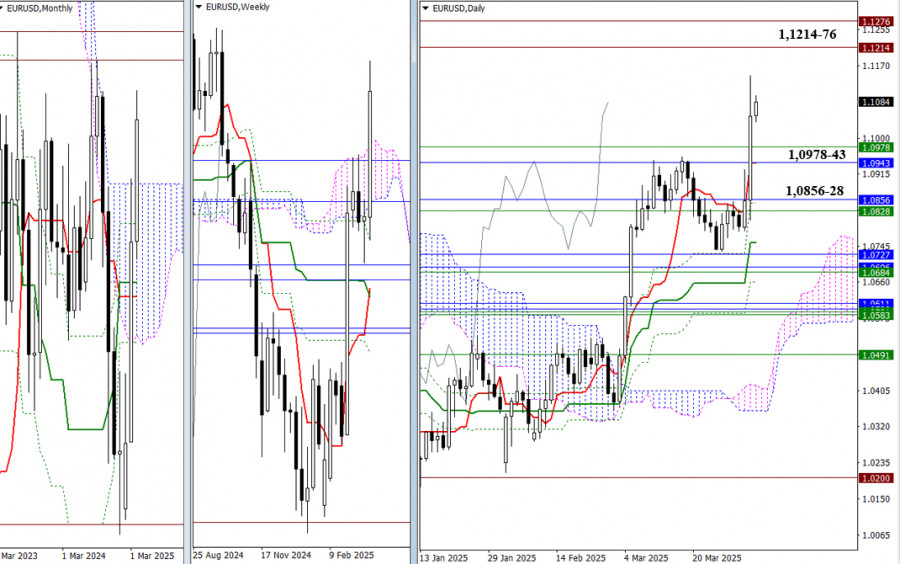
After several attempts and three weeks of consolidation, the bulls finally launched a breakout, allowing them to close yesterday well above the resistance levels of the Ichimoku Cloud on the monthly (1.0943) and weekly (1.0978) timeframes. Today marks the weekly close, and the bulls need to hold on to these gains. If the upward move continues, the pair may test the previous highs (1.1214 – 1.1276). If the gains are lost, the levels that have been breached may now act as support. Potential downside targets include the zones around 1.0978 – 1.0943 and 1.0856 – 1.0828.
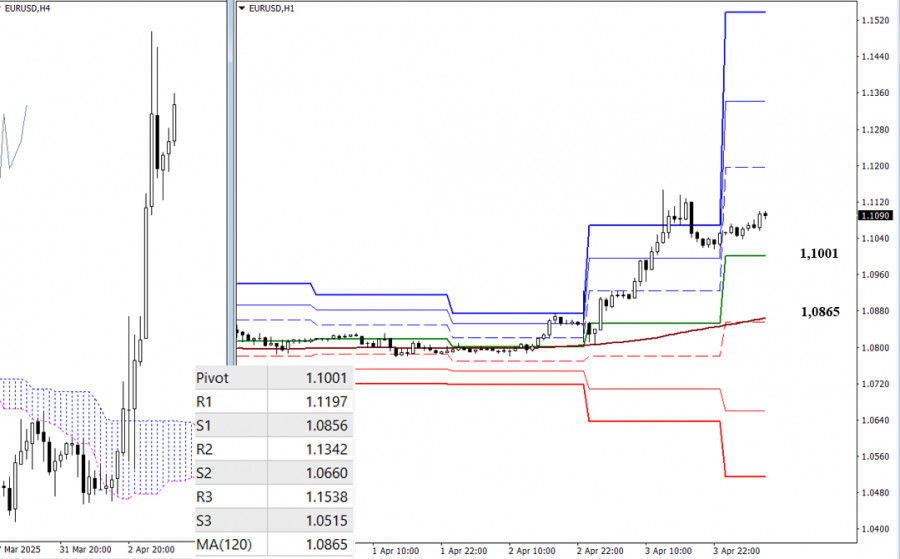
Yesterday's momentum significantly expanded the boundaries of the classic Pivot levels. The resistance levels are at 1.1197 – 1.1342 – 1.1538 for further upward movement. Should the bears opt for a corrective pullback, they will encounter key levels at 1.1001 (daily central Pivot level) and 1.0865 (weekly long-term trend). A break below and reversal of the trend would allow the bears to shift the current balance of power in their favor. Further development of bearish sentiment would lead the pair toward the support levels of the classic Pivot points (1.0856 – 1.0660 – 1.0515).
***
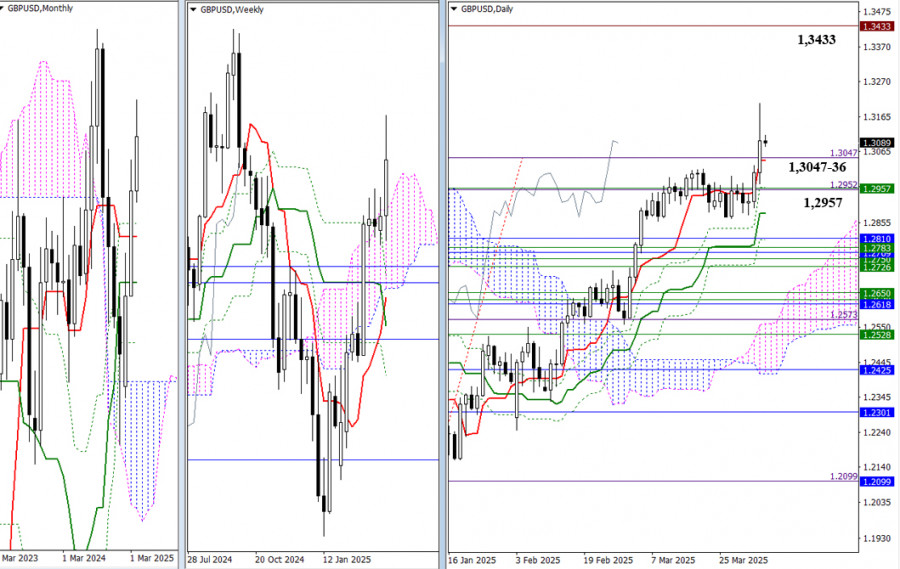
Out of the three weeks of uncertainty, the bulls were the first to break out. They pushed past the final daily target level (1.3047) without a retest. As the week draws to a close, holding on to the gains is crucial. If the upward movement continues, the bulls will aim for the previous high (1.3433). A breakout above that level would signal the end of the current monthly correction. If the bulls fail, their opponents could reclaim the advantage by breaking below the daily short-term trend support (1.3036) and quickly return the pair to the previous consolidation zone, centered around the upper boundary of the weekly Ichimoku cloud (1.2957).
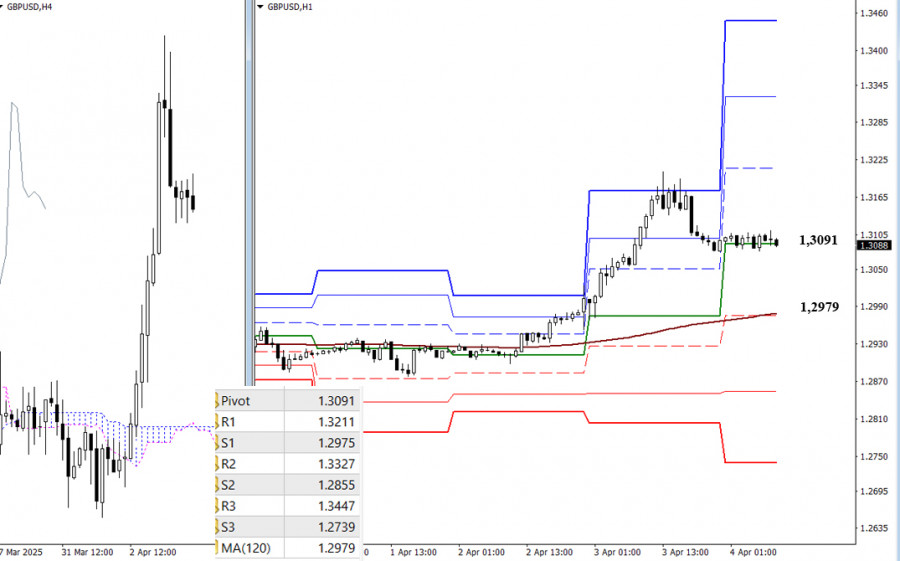
On the lower timeframes, the market is currently hovering around the central Pivot level (1.3091). Continuing the corrective pullback could lead the pair to test the weekly long-term trend level (1.2979), which currently reflects the existing balance of power. A break below this level would shift the main advantage to the bears. Further strengthening of bearish momentum could bring the pair down to the classic Pivot support levels at 1.2855 and 1.2739. If the bulls halt the correction at this stage, further upside potential would be realized through resistance levels at 1.3211 – 1.3327 – 1.3447.
***
You have already liked this post today
*Analisis pasar yang diposting disini dimaksudkan untuk meningkatkan pengetahuan Anda namun tidak untuk memberi instruksi trading.
Dengan munculnya Divergent serta pola Descending Broadening Wedge pada chart 4 jam dari pasangan mata uang silang AUD/JPY, meski pergerakan harganya berada dibawah EMA (21) memiliki kemiringan yang menurun, namun
Pada chart 4 jamnya pasangan mata uang utama USD/JPY nampak terlihat kalau indikator Stochastic Oscillator membentuk pola Double Bottom sedangkan pergerakan harga dari USD/JPY membentuk Higher High sehingga Divergent
Pada chart 4 jam dari pasangan mata uang utama USD/JPY, nampak terlihat kalau indikator Stochastic Oscillator membentuk pola Double Bottom sedangkan pergerakan harga dari USD/JPY membentuk Higher High sehingga Divergent
Pada awal sesi Amerika, emas diperdagangkan di sekitar level 3.310, yang terletak di SMA 21 dalam pola triangle simetris yang terbentuk pada 23 April. Konsolidasi kemungkinan akan terbentuk dalam beberapa
Rencana trading kami untuk beberapa jam ke depan adalah menjual di bawah 1.1410 dengan target di 1.1370 dan 1.1230. Indikator eagle memberikan sinyal negatif, jadi kami percaya koreksi teknis dapat
Pada chart 4 jamnya instrumen komoditi Minyak Mentah nampak terlihat bergerak dibawah WMA (21) yang juga memiliki kemiringan slope yang menurun dimana ini berarti saat ini Seller tengah mendominasi
Bila Kita perhatikan chart 4 jam pasangan mata uang silang GBP/JPY nampak terlihat dua hal yang menarik pertama munculnya pola Rising Wedge, kedua terdapat Divergent antara pergerakan harga GBP/JPY dengan
Di sisi lain, jika tekanan bearish mendominasi dan euro terkonsolidasi di bawah 1.1370, ini dapat dianggap sebagai sinyal jual dengan target di 6/8 Murray yang terletak di 1.1230 dan akhirnya
Pada sesi Amerika awal, emas diperdagangkan di sekitar 3.299 dalam channel tren menurun yang terbentuk sejak 21 April, menunjukkan pemulihan di atas support pada 3.270. Pada grafik H4, kita dapat
Your IP address shows that you are currently located in the USA. If you are a resident of the United States, you are prohibited from using the services of InstaFintech Group including online trading, online transfers, deposit/withdrawal of funds, etc.
If you think you are seeing this message by mistake and your location is not the US, kindly proceed to the website. Otherwise, you must leave the website in order to comply with government restrictions.
Why does your IP address show your location as the USA?
Please confirm whether you are a US resident or not by clicking the relevant button below. If you choose the wrong option, being a US resident, you will not be able to open an account with InstaTrade anyway.
We are sorry for any inconvenience caused by this message.


