Pola sebenarnya

Triple Top
was formed on 30.03 at 11:20:04 (UTC+0)
signal strength 1 of 5

On the chart of the #Bitcoin M5 trading instrument, the Triple Top pattern that signals a trend change has formed. It is possible that after formation of the third peak, the price will try to break through the resistance level 82818.73, where we advise to open a trading position for sale. Take profit is the projection of the pattern’s width, which is 46117 points.
The M5 and M15 time frames may have more false entry points.
Lihat juga
- All
- All
- Bearish Rectangle
- Bearish Symmetrical Triangle
- Bearish Symmetrical Triangle
- Bullish Rectangle
- Double Top
- Double Top
- Triple Bottom
- Triple Bottom
- Triple Top
- Triple Top
- All
- All
- Buy
- Sale
- All
- 1
- 2
- 3
- 4
- 5
Double Bottom
was formed on 17.04 at 20:20:19 (UTC+0)
signal strength 1 of 5

The Double Bottom pattern has been formed on EURNZD M5. Characteristics: the support level 1.8992; the resistance level 1.9020; the width of the pattern 28 points. If the resistance level
The M5 and M15 time frames may have more false entry points.
Open chart in a new window
Double Top
was formed on 17.04 at 19:47:53 (UTC+0)
signal strength 2 of 5
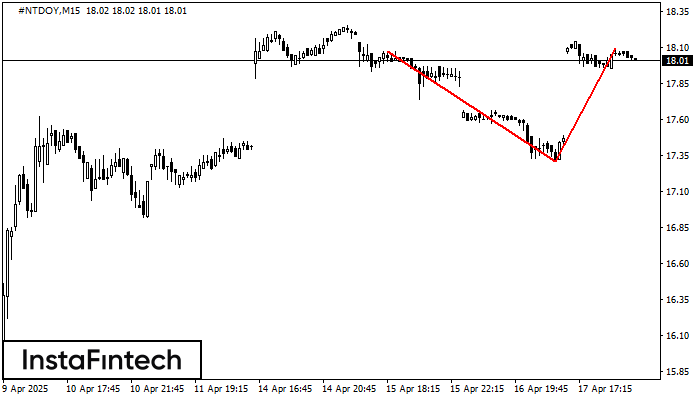
The Double Top reversal pattern has been formed on #NTDOY M15. Characteristics: the upper boundary 18.07; the lower boundary 17.31; the width of the pattern is 78 points. Sell trades
The M5 and M15 time frames may have more false entry points.
Open chart in a new window
Bullish pennant
was formed on 17.04 at 19:46:18 (UTC+0)
signal strength 2 of 5

The Bullish pennant pattern is formed on the AUDJPY M15 chart. It is a type of the continuation pattern. Supposedly, in case the price is fixed above the pennant’s high
The M5 and M15 time frames may have more false entry points.
Open chart in a new window