Pola sebenarnya

Double Bottom
was formed on 30.03 at 15:20:10 (UTC+0)
signal strength 1 of 5
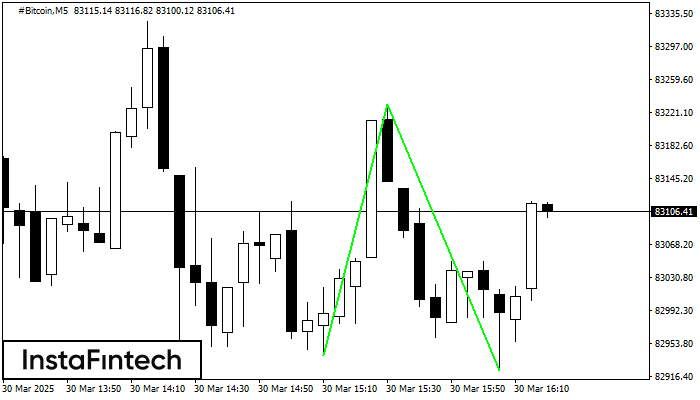
The Double Bottom pattern has been formed on #Bitcoin M5. This formation signals a reversal of the trend from downwards to upwards. The signal is that a buy trade should be opened after the upper boundary of the pattern 83229.64 is broken. The further movements will rely on the width of the current pattern 28940 points.
The M5 and M15 time frames may have more false entry points.
- All
- All
- Bearish Rectangle
- Bearish Symmetrical Triangle
- Bearish Symmetrical Triangle
- Bullish Rectangle
- Double Top
- Double Top
- Triple Bottom
- Triple Bottom
- Triple Top
- Triple Top
- All
- All
- Buy
- Sale
- All
- 1
- 2
- 3
- 4
- 5
Teratas Ganda
was formed on 30.04 at 23:00:21 (UTC+0)
signal strength 5 of 5

Pada grafik NZDCAD D1 pola reversal Teratas Ganda telah terbentuk. Karakteristik: batas atas 0.8316; batas bawah 0.7826; lebar pola 490 poin. Sinyal: tembusan ke batas bawah akan menyebabkan kelanjutan tren
Open chart in a new window
Bawah Triple
was formed on 30.04 at 22:40:20 (UTC+0)
signal strength 1 of 5
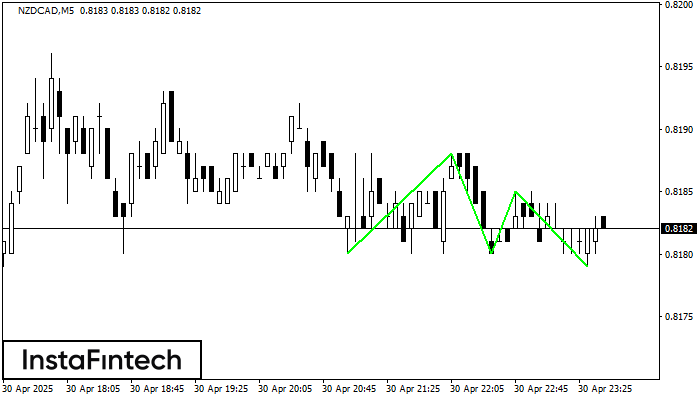
Pola Bawah Triple telah terbentuk pada NZDCAD M5. Pola tersebut memiliki karakteristik sebagai berikut: level resistance 0.8188/0.8185; level support 0.8180/0.8179; dengan lebar 8 poin. Jika terjadi pemecahan (breakdown) pada level
Rangka waktu M5 dan M15 mungkin memiliki lebih dari titik entri yang keliru.
Open chart in a new window
Segitiga Simetris Bullish
was formed on 30.04 at 21:56:12 (UTC+0)
signal strength 2 of 5

Menurut Grafik dari M15, #Bitcoin dibentuk pola Segitiga Simetris Bullish. Batas yang lebih rendah dari pola menyentuh kordinat 92482.78/94081.93 dimana batas atas berada sepanjang 95186.64/94081.93. Jika pola Segitiga Simetris Bullish
Rangka waktu M5 dan M15 mungkin memiliki lebih dari titik entri yang keliru.
Open chart in a new window