

Pola sebenarnya

Bullish Rectangle
was formed on 01.04 at 21:01:49 (UTC+0)
signal strength 2 of 5
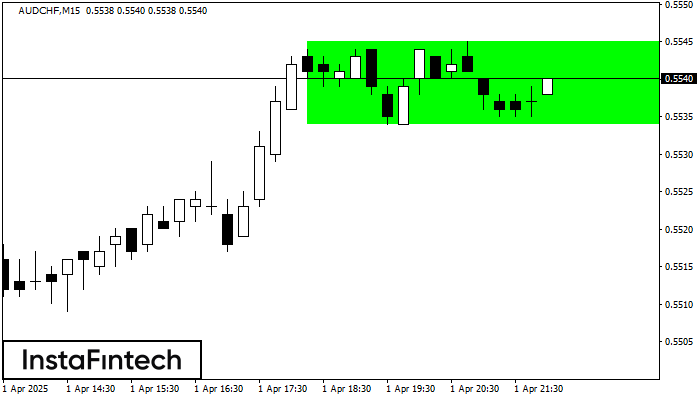
According to the chart of M15, AUDCHF formed the Bullish Rectangle. This type of a pattern indicates a trend continuation. It consists of two levels: resistance 0.5545 and support 0.5534. In case the resistance level 0.5545 - 0.5545 is broken, the instrument is likely to follow the bullish trend.
The M5 and M15 time frames may have more false entry points.
- All
- All
- Bearish Rectangle
- Bearish Symmetrical Triangle
- Bearish Symmetrical Triangle
- Bullish Rectangle
- Double Top
- Double Top
- Triple Bottom
- Triple Bottom
- Triple Top
- Triple Top
- All
- All
- Buy
- Sale
- All
- 1
- 2
- 3
- 4
- 5
ডাবল বটম
was formed on 28.05 at 04:45:28 (UTC+0)
signal strength 1 of 5
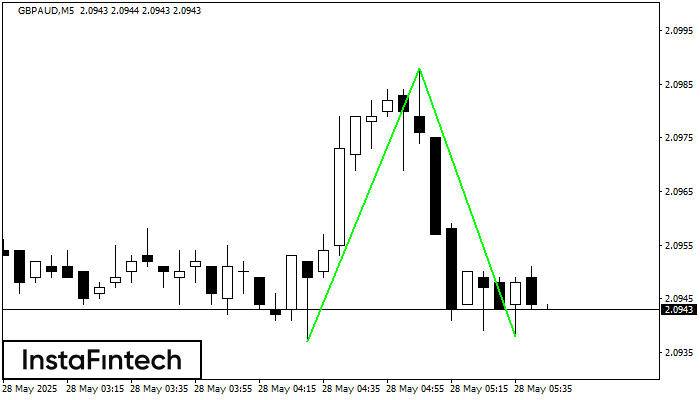
M5 চার্টে, GBPAUD-এর ডাবল বটম প্যাটার্নটি গঠিত হয়েছে। উপরের সীমানা হল 2.0988; নীচের সীমানা হল 2.0938। প্যাটার্নের প্রস্থ হল 51 পয়েন্ট। 2.0988-এর উপরের সীমানা ভেদ করার ক্ষেত্রে, প্রবণতা পরিবর্তনের পূর্বাভাস
M5 এবং M15 টাইম ফ্রেমে আরও ভুল এন্ট্রি পয়েন্ট থাকতে পারে।
Open chart in a new window
ট্রিপল বটম
was formed on 28.05 at 04:36:13 (UTC+0)
signal strength 1 of 5
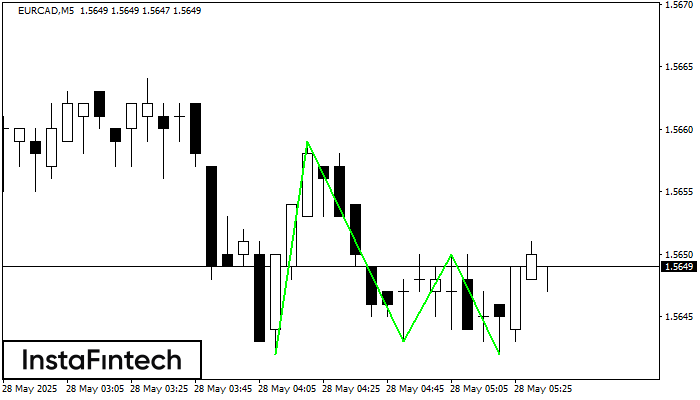
M5 চার্টে, EURCAD ট্রেডিং ইন্সট্রুমেন্টের ট্রিপল বটম প্যাটার্ন গঠিত হয়েছে। 1.5659/1.5650 ব্রেকডাউনের ক্ষেত্রে এই প্যাটার্ন নিম্নমুখী প্রবণতা থেকে ঊর্ধ্বমুখী প্রবণতায় পরিবর্তনের সংকেত দেয়৷
M5 এবং M15 টাইম ফ্রেমে আরও ভুল এন্ট্রি পয়েন্ট থাকতে পারে।
Open chart in a new window
বিয়ারিশ পেন্যান্ট
was formed on 28.05 at 04:02:50 (UTC+0)
signal strength 1 of 5
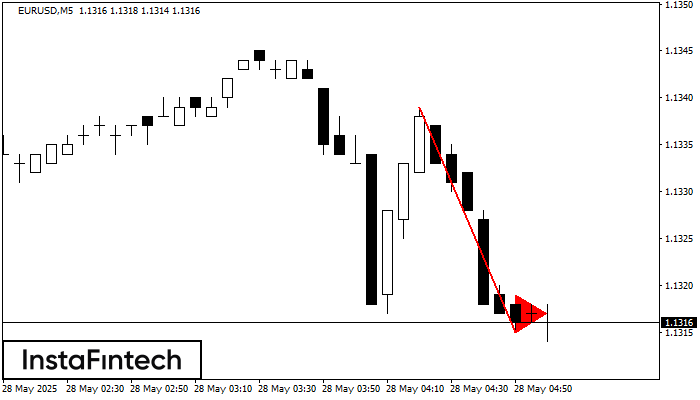
M5 চার্টে EURUSD-এর বিয়ারিশ পেন্যান্ট প্যাটার্ন গঠিত হয়েছে৷ পেন্যান্টের সর্বনিম্ন 1.1315 ব্রেক করার ক্ষেত্রে, এই প্যাটার্ন নিম্নমুখী প্রবণতার ধারাবাহিকতা নির্দেশ করে। পরামর্শ: এই প্যাটার্নের সর্বনিম্ন স্তরের 10 পিপস নীচে পেন্ডিং
M5 এবং M15 টাইম ফ্রেমে আরও ভুল এন্ট্রি পয়েন্ট থাকতে পারে।
Open chart in a new window


