

Pola sebenarnya

Bullish Symmetrical Triangle
was formed on 14.04 at 04:00:58 (UTC+0)
signal strength 4 of 5

According to the chart of H1, EURNZD formed the Bullish Symmetrical Triangle pattern. Description: This is the pattern of a trend continuation. 2.0005 and 1.9118 are the coordinates of the upper and lower borders respectively. The pattern width is measured on the chart at 887 pips. Outlook: If the upper border 2.0005 is broken, the price is likely to continue its move by 1.9525.
- All
- All
- Bearish Rectangle
- Bearish Symmetrical Triangle
- Bearish Symmetrical Triangle
- Bullish Rectangle
- Double Top
- Double Top
- Triple Bottom
- Triple Bottom
- Triple Top
- Triple Top
- All
- All
- Buy
- Sale
- All
- 1
- 2
- 3
- 4
- 5
Triple Top
was formed on 30.04 at 19:16:06 (UTC+0)
signal strength 1 of 5
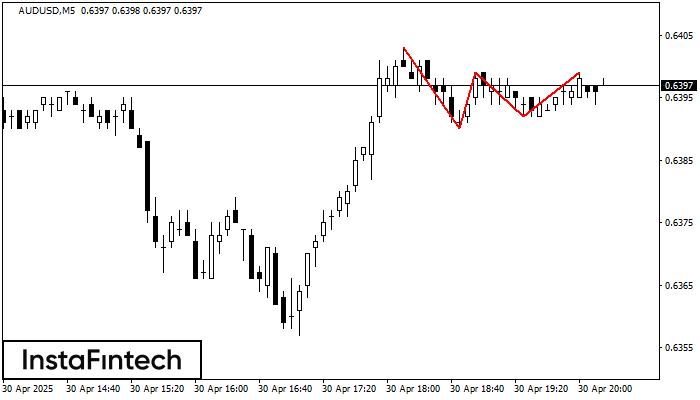
On the chart of the AUDUSD M5 trading instrument, the Triple Top pattern that signals a trend change has formed. It is possible that after formation of the third peak
The M5 and M15 time frames may have more false entry points.
Open chart in a new window
Double Top
was formed on 30.04 at 19:10:29 (UTC+0)
signal strength 1 of 5
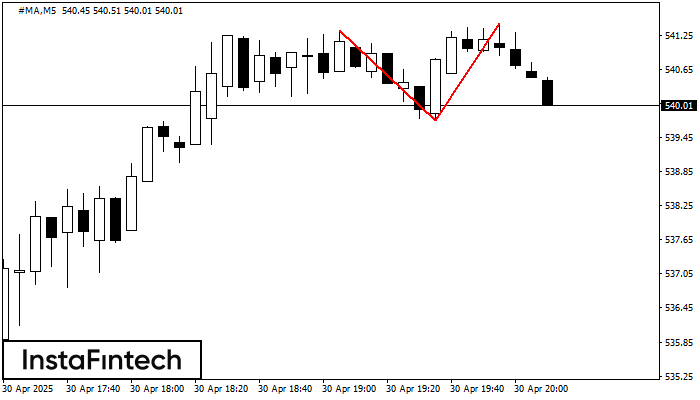
On the chart of #MA M5 the Double Top reversal pattern has been formed. Characteristics: the upper boundary 541.46; the lower boundary 539.75; the width of the pattern 171 points
The M5 and M15 time frames may have more false entry points.
Open chart in a new window
Double Bottom
was formed on 30.04 at 19:00:57 (UTC+0)
signal strength 1 of 5
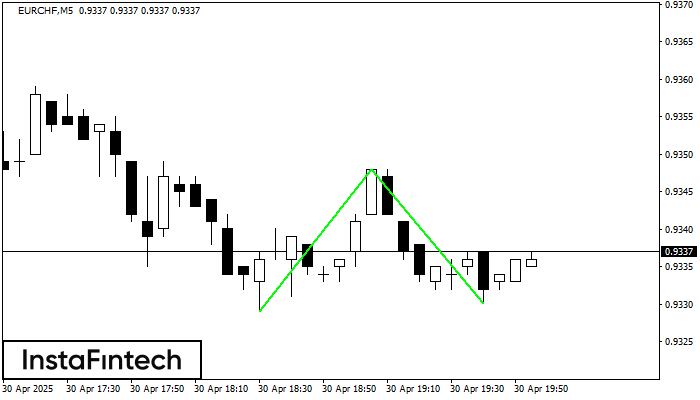
The Double Bottom pattern has been formed on EURCHF M5; the upper boundary is 0.9348; the lower boundary is 0.9330. The width of the pattern is 19 points. In case
The M5 and M15 time frames may have more false entry points.
Open chart in a new window


