Pola sebenarnya

Head and Shoulders
was formed on 14.04 at 05:15:40 (UTC+0)
signal strength 1 of 5

According to the chart of M5, EURCAD formed the Head and Shoulders pattern. The Head’s top is set at 1.5811 while the median line of the Neck is found at 1.5747/1.5755. The formation of the Head and Shoulders pattern evidently signals a reversal of the upward trend. In other words, in case the scenario comes true, the price of EURCAD will go towards 1.5740.
The M5 and M15 time frames may have more false entry points.
Lihat juga
- All
- All
- Bearish Rectangle
- Bearish Symmetrical Triangle
- Bearish Symmetrical Triangle
- Bullish Rectangle
- Double Top
- Double Top
- Triple Bottom
- Triple Bottom
- Triple Top
- Triple Top
- All
- All
- Buy
- Sale
- All
- 1
- 2
- 3
- 4
- 5
Teratas Ganda
was formed on 30.04 at 17:55:22 (UTC+0)
signal strength 1 of 5
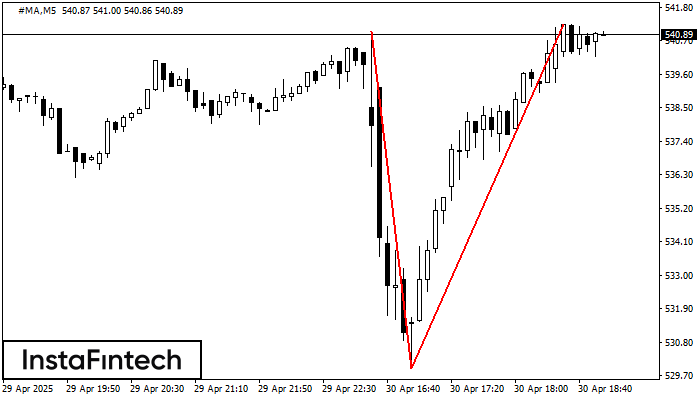
Pada grafik #MA M5 pola reversal Teratas Ganda telah terbentuk. Karakteristik: batas atas 541.24; batas bawah 529.93; lebar pola 1131 poin. Sinyal: tembusan ke batas bawah akan menyebabkan kelanjutan tren
Rangka waktu M5 dan M15 mungkin memiliki lebih dari titik entri yang keliru.
Open chart in a new window
Panji Bearish
was formed on 30.04 at 16:35:46 (UTC+0)
signal strength 2 of 5
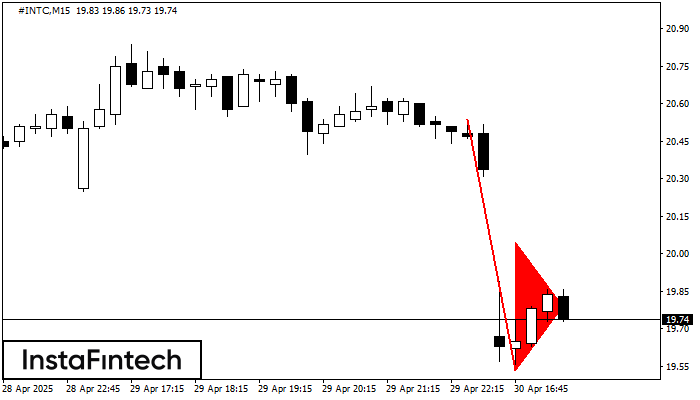
Pola Panji Bearish telah terbentuk di grafik Panji Bearish. Pola ini memberikan sinyal kelanjutan tren menurun jika titik terendah panji, di 19.53 ditembus. Rekomendasi: Tempatkan sell stop pending order
Rangka waktu M5 dan M15 mungkin memiliki lebih dari titik entri yang keliru.
Open chart in a new window
Persegi Bearish
was formed on 30.04 at 16:31:32 (UTC+0)
signal strength 3 of 5
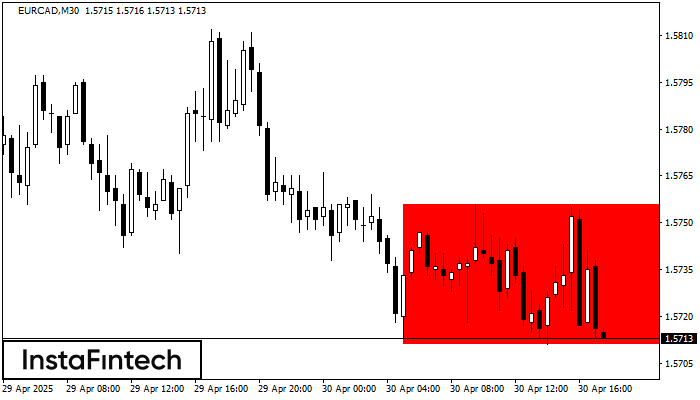
Menurut grafik dari M30, EURCAD terbentuk Persegi Bearish yang merupakan pola dari kelanjutan tren. Pola terkandung di dalam batas berikut: batas lebih rendah 1.5711 – 1.5711 dan batas atas 1.5756
Open chart in a new window