Pola sebenarnya

Bullish Symmetrical Triangle
was formed on 14.04 at 06:47:26 (UTC+0)
signal strength 2 of 5
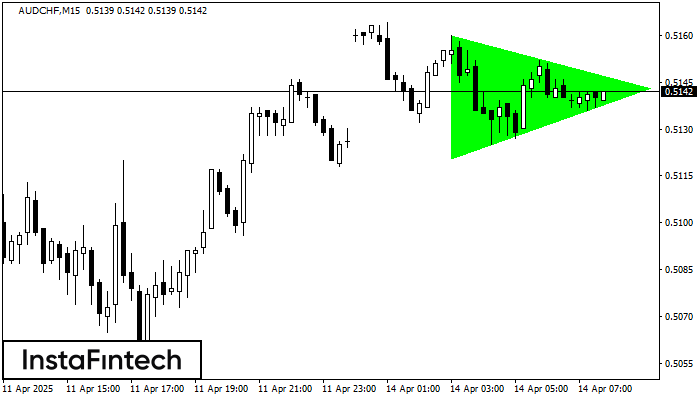
According to the chart of M15, AUDCHF formed the Bullish Symmetrical Triangle pattern, which signals the trend will continue. Description. The upper border of the pattern touches the coordinates 0.5160/0.5143 whereas the lower border goes across 0.5120/0.5143. The pattern width is measured on the chart at 40 pips. If the Bullish Symmetrical Triangle pattern is in progress during the upward trend, this indicates the current trend will go on. In case 0.5143 is broken, the price could continue its move toward 0.5166.
The M5 and M15 time frames may have more false entry points.
Lihat juga
- All
- All
- Bearish Rectangle
- Bearish Symmetrical Triangle
- Bearish Symmetrical Triangle
- Bullish Rectangle
- Double Top
- Double Top
- Triple Bottom
- Triple Bottom
- Triple Top
- Triple Top
- All
- All
- Buy
- Sale
- All
- 1
- 2
- 3
- 4
- 5
Bawah Ganda
was formed on 30.04 at 13:45:29 (UTC+0)
signal strength 2 of 5
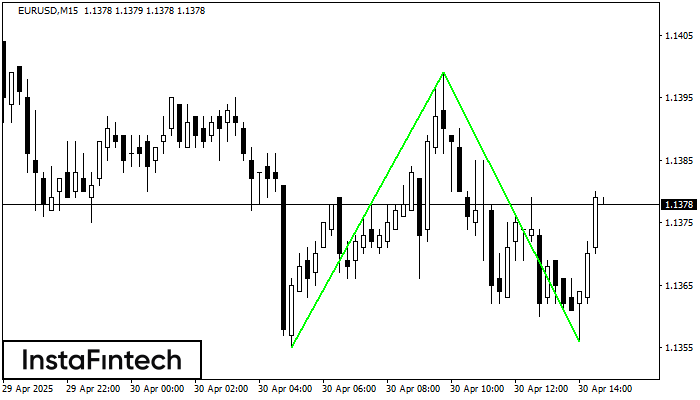
Pola Bawah Ganda telah terbentuk pada EURUSD M15. Karakteristik: level support 1.1355; level resistance 1.1399; lebar pola 44 poin. Jika level resistance ditembus, perubahan dalam tren dapat diprediksi dengan target
Rangka waktu M5 dan M15 mungkin memiliki lebih dari titik entri yang keliru.
Open chart in a new window
Bawah Triple
was formed on 30.04 at 13:30:55 (UTC+0)
signal strength 1 of 5
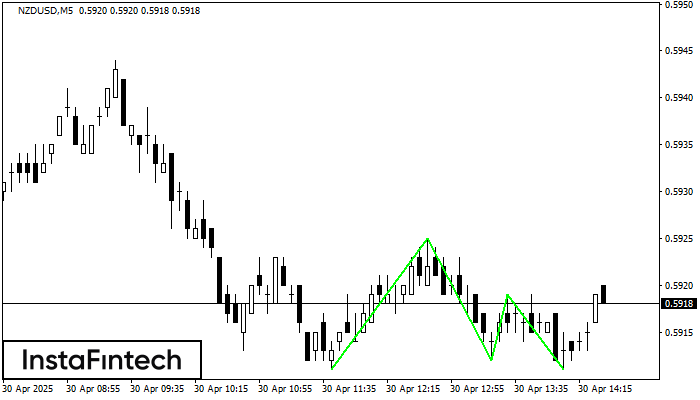
Pola Bawah Triple telah terbentuk pada grafik NZDUSD M5. Fitur-fitur pola: garis bawah pola memiliki koordinat 0.5925 dengan batas atas 0.5925/0.5919, proyeksi lebar adalah 14 poin. Pembentukan pola Bawah Triple
Rangka waktu M5 dan M15 mungkin memiliki lebih dari titik entri yang keliru.
Open chart in a new window
Bawah Ganda
was formed on 30.04 at 13:30:34 (UTC+0)
signal strength 2 of 5
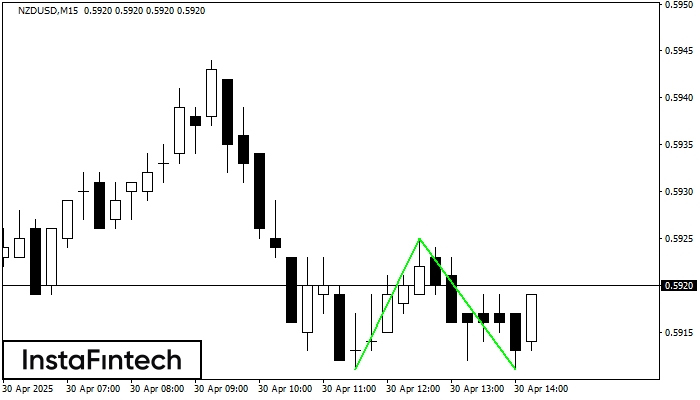
Pola Bawah Ganda telah terbentuk pada NZDUSD M15. Formasi ini mensinyalkan reversal tren dari arah penurunan ke arah kenaikan. Sinyal menunjukkan bahwa transaksi beli harus dibuka setelah batas atas pola
Rangka waktu M5 dan M15 mungkin memiliki lebih dari titik entri yang keliru.
Open chart in a new window