

Pola sebenarnya

Bullish Symmetrical Triangle
was formed on 16.04 at 17:03:02 (UTC+0)
signal strength 3 of 5
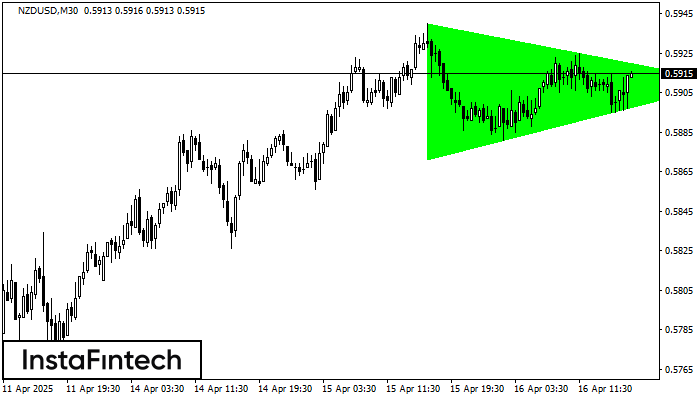
According to the chart of M30, NZDUSD formed the Bullish Symmetrical Triangle pattern. The lower border of the pattern touches the coordinates 0.5871/0.5910 whereas the upper border goes across 0.5940/0.5910. If the Bullish Symmetrical Triangle pattern is in progress, this evidently signals a further upward trend. In other words, in case the scenario comes true, the price of NZDUSD will breach the upper border to head for 0.5940.
- All
- All
- Bearish Rectangle
- Bearish Symmetrical Triangle
- Bearish Symmetrical Triangle
- Bullish Rectangle
- Double Top
- Double Top
- Triple Bottom
- Triple Bottom
- Triple Top
- Triple Top
- All
- All
- Buy
- Sale
- All
- 1
- 2
- 3
- 4
- 5
Triple Top
was formed on 28.05 at 12:00:34 (UTC+0)
signal strength 2 of 5
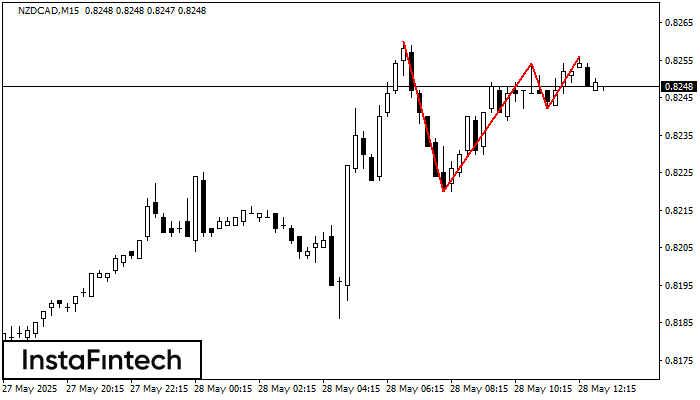
The Triple Top pattern has formed on the chart of the NZDCAD M15 trading instrument. It is a reversal pattern featuring the following characteristics: resistance level 4, support level -22
The M5 and M15 time frames may have more false entry points.
Open chart in a new window
Bullish Rectangle
was formed on 28.05 at 11:56:01 (UTC+0)
signal strength 1 of 5
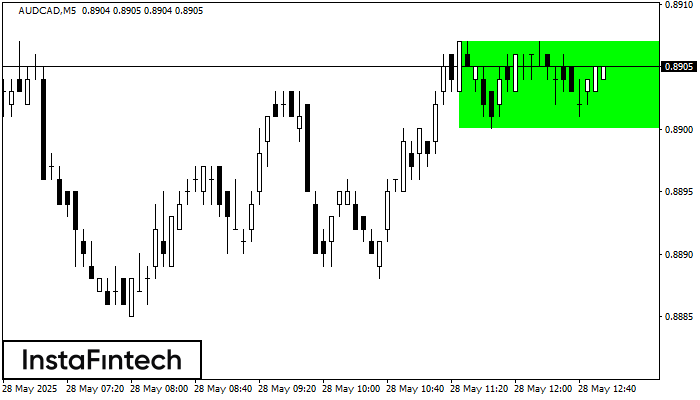
According to the chart of M5, AUDCAD formed the Bullish Rectangle. The pattern indicates a trend continuation. The upper border is 0.8907, the lower border is 0.8900. The signal means
The M5 and M15 time frames may have more false entry points.
Open chart in a new window
Double Top
was formed on 28.05 at 11:30:32 (UTC+0)
signal strength 1 of 5
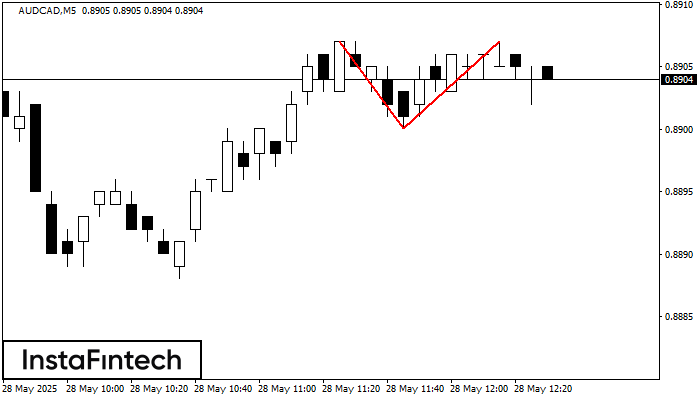
The Double Top reversal pattern has been formed on AUDCAD M5. Characteristics: the upper boundary 0.8907; the lower boundary 0.8900; the width of the pattern is 7 points. Sell trades
The M5 and M15 time frames may have more false entry points.
Open chart in a new window


