Pola sebenarnya

Bullish Rectangle
was formed on 17.04 at 05:00:58 (UTC+0)
signal strength 3 of 5

According to the chart of M30, EURGBP formed the Bullish Rectangle. This type of a pattern indicates a trend continuation. It consists of two levels: resistance 0.8615 and support 0.8598. In case the resistance level 0.8615 - 0.8615 is broken, the instrument is likely to follow the bullish trend.
- All
- All
- Bearish Rectangle
- Bearish Symmetrical Triangle
- Bearish Symmetrical Triangle
- Bullish Rectangle
- Double Top
- Double Top
- Triple Bottom
- Triple Bottom
- Triple Top
- Triple Top
- All
- All
- Buy
- Sale
- All
- 1
- 2
- 3
- 4
- 5
Double Bottom
сформирован 29.05 в 12:59:54 (UTC+0)
сила сигнала 2 из 5
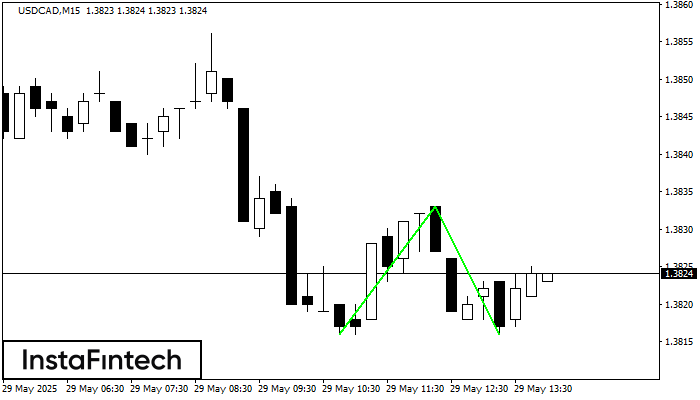
The Double Bottom pattern has been formed on USDCAD M15. This formation signals a reversal of the trend from downwards to upwards. The signal is that a buy trade should
The M5 and M15 time frames may have more false entry points.
Открыть график инструмента в новом окне
Triple Bottom
сформирован 29.05 в 12:44:43 (UTC+0)
сила сигнала 1 из 5
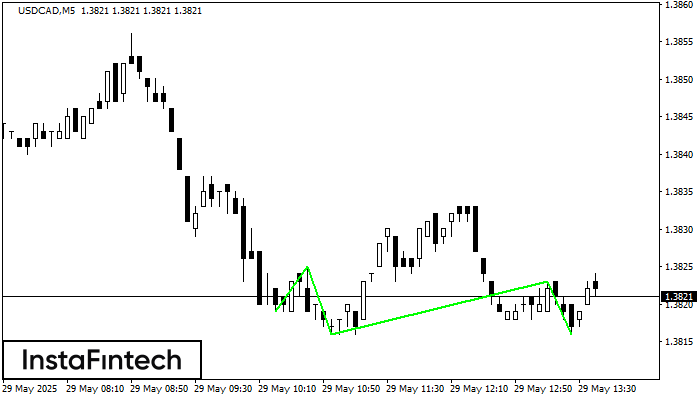
The Triple Bottom pattern has formed on the chart of USDCAD M5. Features of the pattern: The lower line of the pattern has coordinates 1.3825 with the upper limit 1.3825/1.3823
The M5 and M15 time frames may have more false entry points.
Открыть график инструмента в новом окне
Bearish Rectangle
сформирован 29.05 в 12:19:14 (UTC+0)
сила сигнала 1 из 5
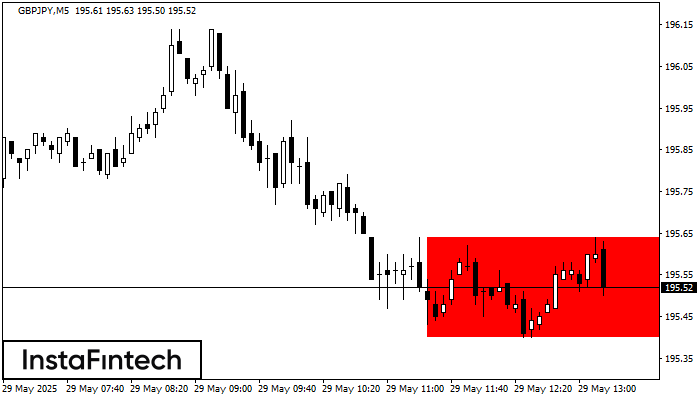
According to the chart of M5, GBPJPY formed the Bearish Rectangle. The pattern indicates a trend continuation. The upper border is 195.64, the lower border is 195.40. The signal means
The M5 and M15 time frames may have more false entry points.
Открыть график инструмента в новом окне