

Pola sebenarnya

Double Bottom
was formed on 17.04 at 08:15:01 (UTC+0)
signal strength 1 of 5
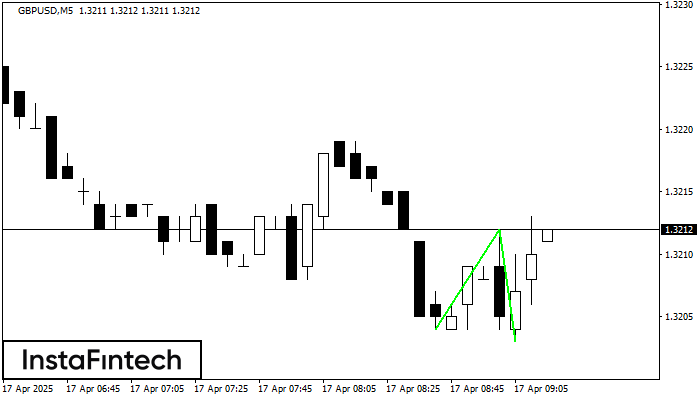
The Double Bottom pattern has been formed on GBPUSD M5; the upper boundary is 1.3212; the lower boundary is 1.3203. The width of the pattern is 8 points. In case of a break of the upper boundary 1.3212, a change in the trend can be predicted where the width of the pattern will coincide with the distance to a possible take profit level.
The M5 and M15 time frames may have more false entry points.
- All
- All
- Bearish Rectangle
- Bearish Symmetrical Triangle
- Bearish Symmetrical Triangle
- Bullish Rectangle
- Double Top
- Double Top
- Triple Bottom
- Triple Bottom
- Triple Top
- Triple Top
- All
- All
- Buy
- Sale
- All
- 1
- 2
- 3
- 4
- 5
Persegi Bullish
was formed on 28.05 at 03:30:25 (UTC+0)
signal strength 2 of 5
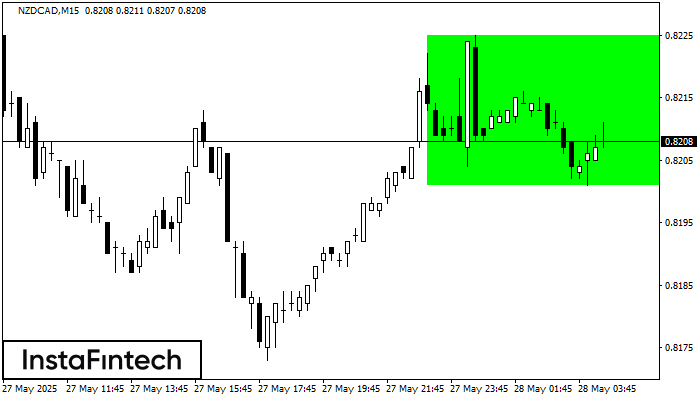
Menurut grafik dari M15, NZDCAD terbentuk Persegi Bullish. Jenis pola ini menunjukkan kelanjutan tren. Terdiri dari dua tingkat: resistance 0.8225 dan support 0.8201. Jika level resistance 0.8225 - 0.8225 ditembus
Rangka waktu M5 dan M15 mungkin memiliki lebih dari titik entri yang keliru.
Open chart in a new window
Teratas Triple
was formed on 28.05 at 03:01:28 (UTC+0)
signal strength 3 of 5
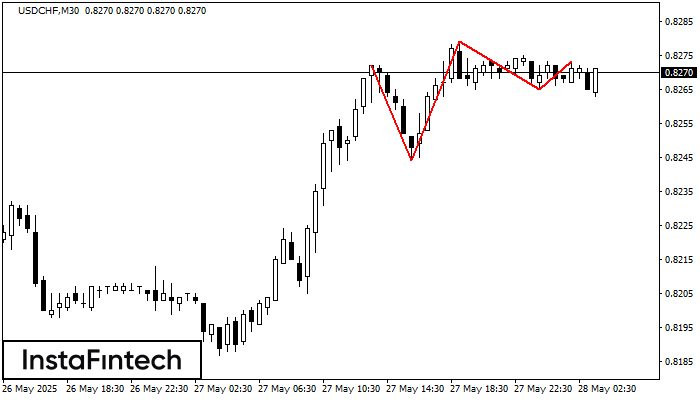
Pola Teratas Triple telah terbentuk pada grafik instrumen trading USDCHF M30. Pola tersebut merupakan pola reversal menampilkan karakteristik berikut: level resistance -1, levek support -21, dan lebar pola 28. Prakiraan
Open chart in a new window
Bawah Triple
was formed on 28.05 at 03:00:31 (UTC+0)
signal strength 2 of 5
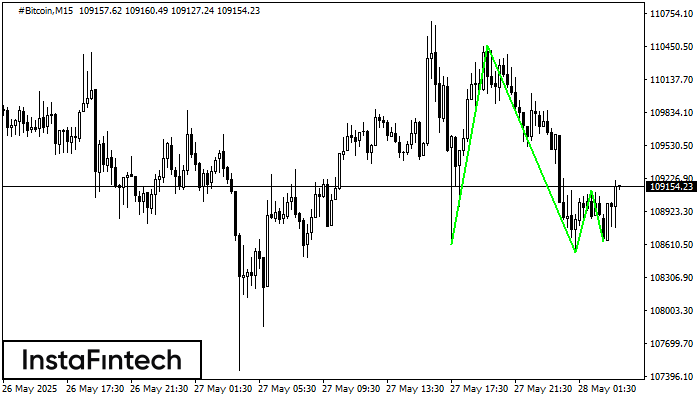
Pola Bawah Triple telah terbentuk pada grafik #Bitcoin M15. Fitur-fitur pola: garis bawah pola memiliki koordinat 110459.83 dengan batas atas 110459.83/109114.84, proyeksi lebar adalah 184898 poin. Pembentukan pola Bawah Triple
Rangka waktu M5 dan M15 mungkin memiliki lebih dari titik entri yang keliru.
Open chart in a new window

