Pola sebenarnya

Bearish Symmetrical Triangle
was formed on 17.04 at 13:57:41 (UTC+0)
signal strength 3 of 5

According to the chart of M30, EURUSD formed the Bearish Symmetrical Triangle pattern. This pattern signals a further downward trend in case the lower border 1.1264 is breached. Here, a hypothetical profit will equal the width of the available pattern that is -195 pips.
- All
- All
- Bearish Rectangle
- Bearish Symmetrical Triangle
- Bearish Symmetrical Triangle
- Bullish Rectangle
- Double Top
- Double Top
- Triple Bottom
- Triple Bottom
- Triple Top
- Triple Top
- All
- All
- Buy
- Sale
- All
- 1
- 2
- 3
- 4
- 5
Double Top
was formed on 30.04 at 14:25:13 (UTC+0)
signal strength 1 of 5
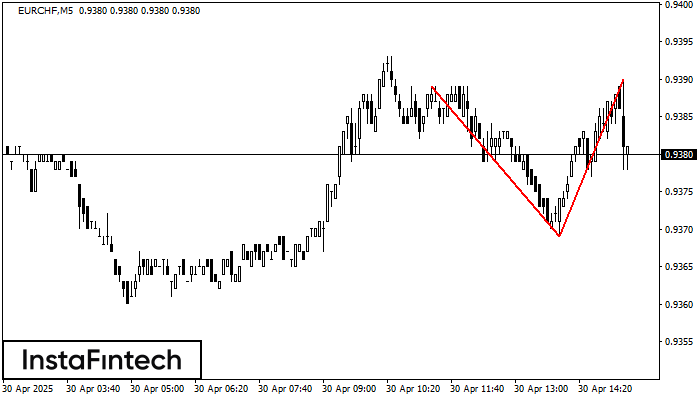
The Double Top pattern has been formed on EURCHF M5. It signals that the trend has been changed from upwards to downwards. Probably, if the base of the pattern 0.9369
The M5 and M15 time frames may have more false entry points.
Open chart in a new window
Bullish Symmetrical Triangle
was formed on 30.04 at 14:24:09 (UTC+0)
signal strength 3 of 5
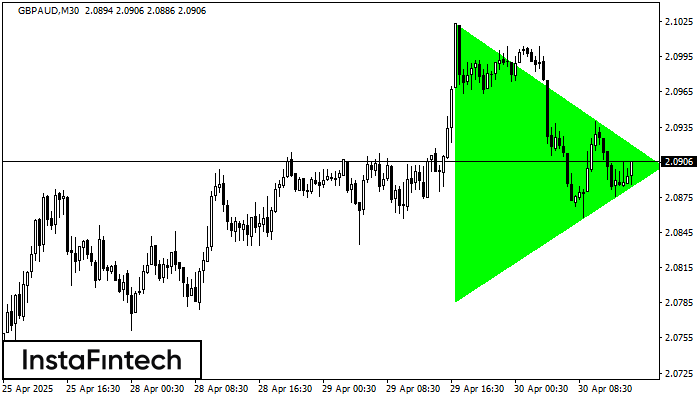
According to the chart of M30, GBPAUD formed the Bullish Symmetrical Triangle pattern. The lower border of the pattern touches the coordinates 2.0786/2.0901 whereas the upper border goes across 2.1023/2.0901
Open chart in a new window
Double Bottom
was formed on 30.04 at 14:00:47 (UTC+0)
signal strength 3 of 5
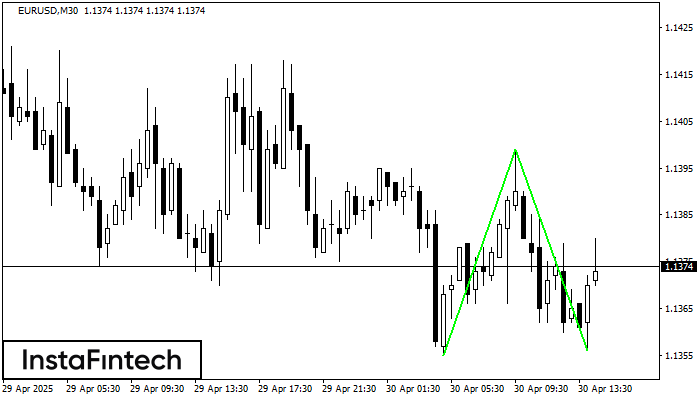
The Double Bottom pattern has been formed on EURUSD M30. Characteristics: the support level 1.1355; the resistance level 1.1399; the width of the pattern 44 points. If the resistance level
Open chart in a new window