

Pola sebenarnya

Double Bottom
was formed on 17.04 at 18:45:14 (UTC+0)
signal strength 2 of 5
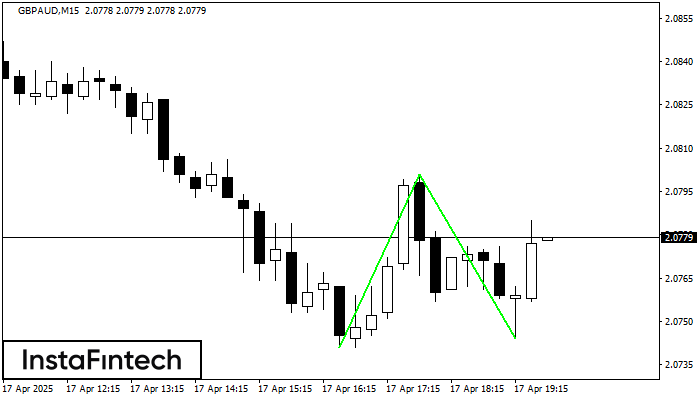
The Double Bottom pattern has been formed on GBPAUD M15; the upper boundary is 2.0801; the lower boundary is 2.0744. The width of the pattern is 60 points. In case of a break of the upper boundary 2.0801, a change in the trend can be predicted where the width of the pattern will coincide with the distance to a possible take profit level.
The M5 and M15 time frames may have more false entry points.
Lihat juga
- All
- All
- Bearish Rectangle
- Bearish Symmetrical Triangle
- Bearish Symmetrical Triangle
- Bullish Rectangle
- Double Top
- Double Top
- Triple Bottom
- Triple Bottom
- Triple Top
- Triple Top
- All
- All
- Buy
- Sale
- All
- 1
- 2
- 3
- 4
- 5
Persegi Bullish
was formed on 30.04 at 10:57:58 (UTC+0)
signal strength 1 of 5
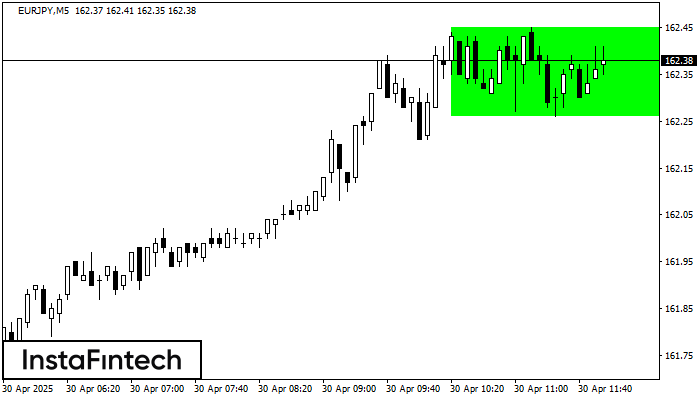
Menurut grafik dari M5, EURJPY terbentuk Persegi Bullish. Jenis pola ini menunjukkan kelanjutan tren. Terdiri dari dua tingkat: resistance 162.45 dan support 162.26. Jika level resistance 162.45 - 162.45 ditembus
Rangka waktu M5 dan M15 mungkin memiliki lebih dari titik entri yang keliru.
Open chart in a new window
Teratas Triple
was formed on 30.04 at 10:25:27 (UTC+0)
signal strength 1 of 5
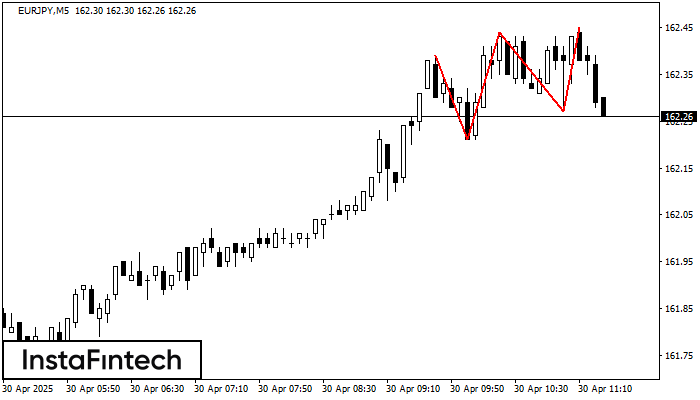
Pola Teratas Triple telah terbentuk pada grafik instrumen trading EURJPY M5. Pola tersebut merupakan pola reversal menampilkan karakteristik berikut: level resistance -6, levek support -6, dan lebar pola 18. Prakiraan
Rangka waktu M5 dan M15 mungkin memiliki lebih dari titik entri yang keliru.
Open chart in a new window
Persegi Bearish
was formed on 30.04 at 10:08:30 (UTC+0)
signal strength 2 of 5
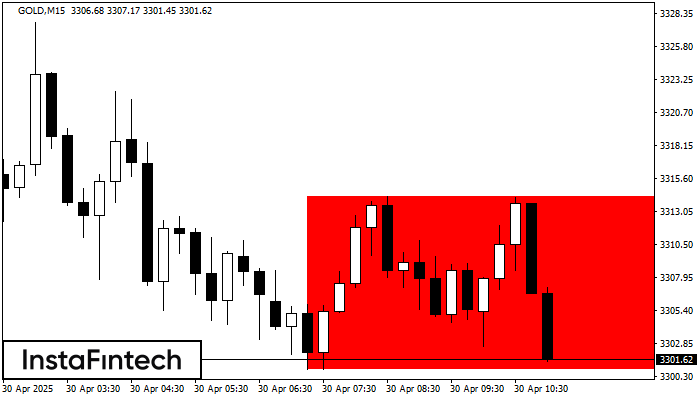
Menurut grafik dari M15, GOLD terbentuk Persegi Bearish. Pola menunjukkan kelanjutan tren. Batas atas adalah 3314.24, batas rendah adalah 3300.82. Sinyal berarti posisi jual harus dibuka setelah menetapkan harga dibawah
Rangka waktu M5 dan M15 mungkin memiliki lebih dari titik entri yang keliru.
Open chart in a new window


