

Pola sebenarnya

Bullish Symmetrical Triangle
was formed on 17.04 at 19:29:11 (UTC+0)
signal strength 1 of 5
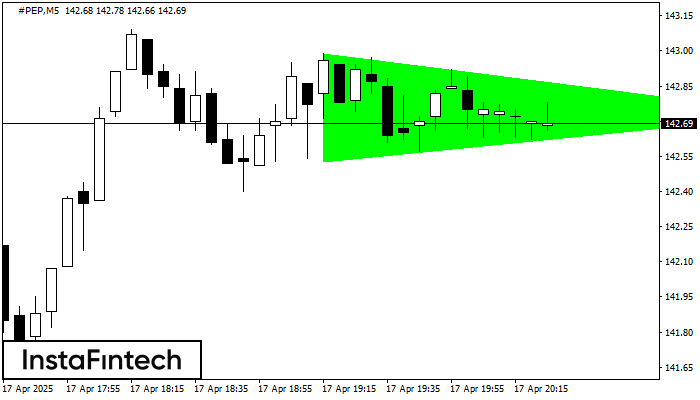
According to the chart of M5, #PEP formed the Bullish Symmetrical Triangle pattern. The lower border of the pattern touches the coordinates 142.53/142.73 whereas the upper border goes across 142.99/142.73. If the Bullish Symmetrical Triangle pattern is in progress, this evidently signals a further upward trend. In other words, in case the scenario comes true, the price of #PEP will breach the upper border to head for 142.88.
The M5 and M15 time frames may have more false entry points.
- All
- All
- Bearish Rectangle
- Bearish Symmetrical Triangle
- Bearish Symmetrical Triangle
- Bullish Rectangle
- Double Top
- Double Top
- Triple Bottom
- Triple Bottom
- Triple Top
- Triple Top
- All
- All
- Buy
- Sale
- All
- 1
- 2
- 3
- 4
- 5
Bawah Ganda
was formed on 29.05 at 15:00:17 (UTC+0)
signal strength 2 of 5
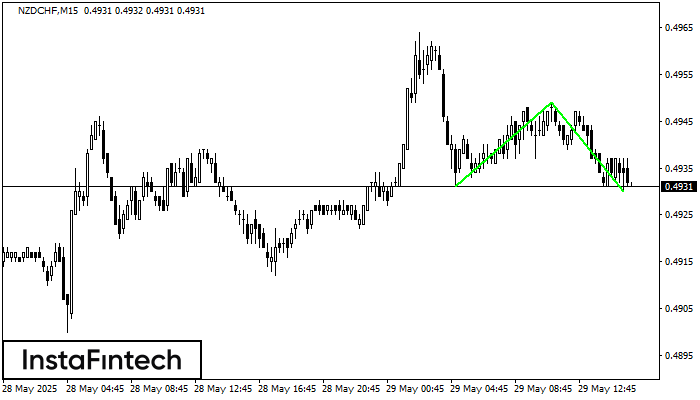
Pola Bawah Ganda telah terbentuk pada NZDCHF M15; batas atas di 0.4949; batas bawah di 0.4930. Lebar pola sebesar 18 poin. Jika harga menembus batas atas 0.4949, Perubahan dalam tren
Rangka waktu M5 dan M15 mungkin memiliki lebih dari titik entri yang keliru.
Open chart in a new window
Persegi Bearish
was formed on 29.05 at 14:04:55 (UTC+0)
signal strength 2 of 5
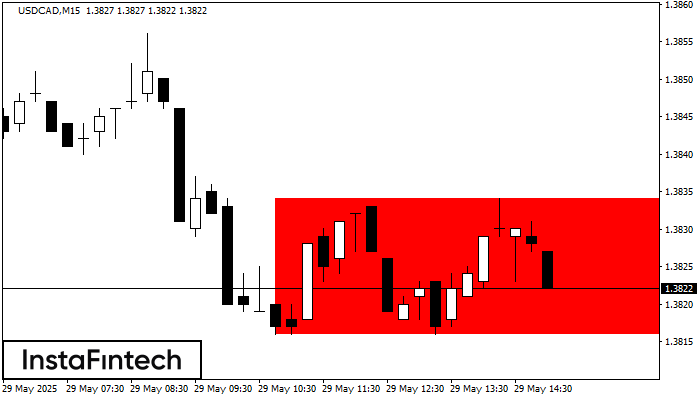
Menurut grafik dari M15, USDCAD terbentuk Persegi Bearish. Pola menunjukkan kelanjutan tren. Batas atas adalah 1.3834, batas rendah adalah 1.3816. Sinyal berarti posisi jual harus dibuka setelah menetapkan harga dibawah
Rangka waktu M5 dan M15 mungkin memiliki lebih dari titik entri yang keliru.
Open chart in a new window
Persegi Bearish
was formed on 29.05 at 13:36:16 (UTC+0)
signal strength 1 of 5
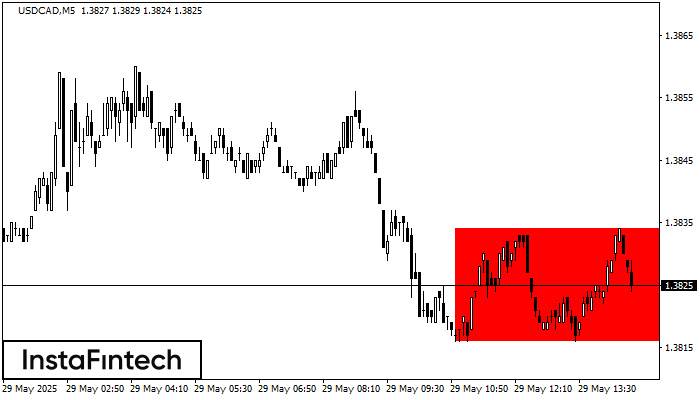
Menurut grafik dari M5, USDCAD terbentuk Persegi Bearish yang merupakan pola dari kelanjutan tren. Pola terkandung di dalam batas berikut: batas lebih rendah 1.3816 – 1.3816 dan batas atas 1.3834
Rangka waktu M5 dan M15 mungkin memiliki lebih dari titik entri yang keliru.
Open chart in a new window

