Pola sebenarnya

Double Bottom
was formed on 17.04 at 20:20:19 (UTC+0)
signal strength 1 of 5

The Double Bottom pattern has been formed on EURNZD M5. Characteristics: the support level 1.8992; the resistance level 1.9020; the width of the pattern 28 points. If the resistance level is broken, a change in the trend can be predicted with the first target point lying at the distance of 26 points.
The M5 and M15 time frames may have more false entry points.
- All
- All
- Bearish Rectangle
- Bearish Symmetrical Triangle
- Bearish Symmetrical Triangle
- Bullish Rectangle
- Double Top
- Double Top
- Triple Bottom
- Triple Bottom
- Triple Top
- Triple Top
- All
- All
- Buy
- Sale
- All
- 1
- 2
- 3
- 4
- 5
Triple Top
was formed on 28.05 at 16:30:35 (UTC+0)
signal strength 3 of 5
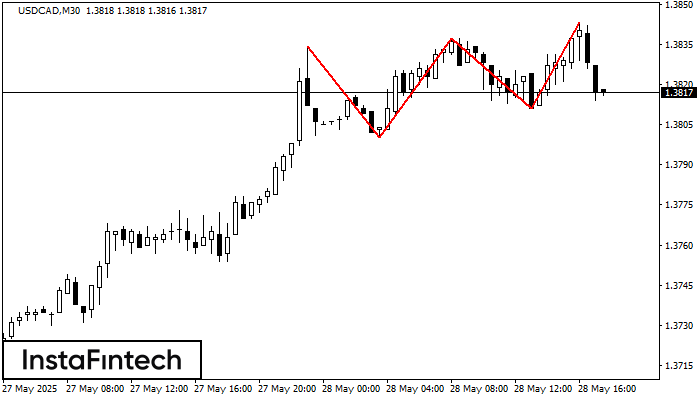
The Triple Top pattern has formed on the chart of the USDCAD M30. Features of the pattern: borders have an ascending angle; the lower line of the pattern
Open chart in a new window
Bullish Rectangle
was formed on 28.05 at 16:27:21 (UTC+0)
signal strength 1 of 5
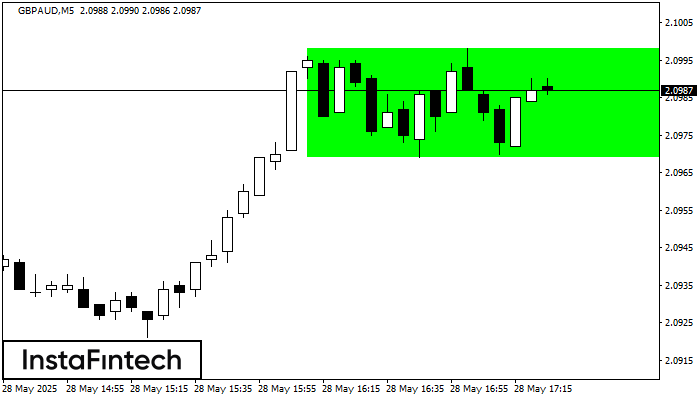
According to the chart of M5, GBPAUD formed the Bullish Rectangle which is a pattern of a trend continuation. The pattern is contained within the following borders: the lower border
The M5 and M15 time frames may have more false entry points.
Open chart in a new window
Double Top
was formed on 28.05 at 16:15:19 (UTC+0)
signal strength 1 of 5
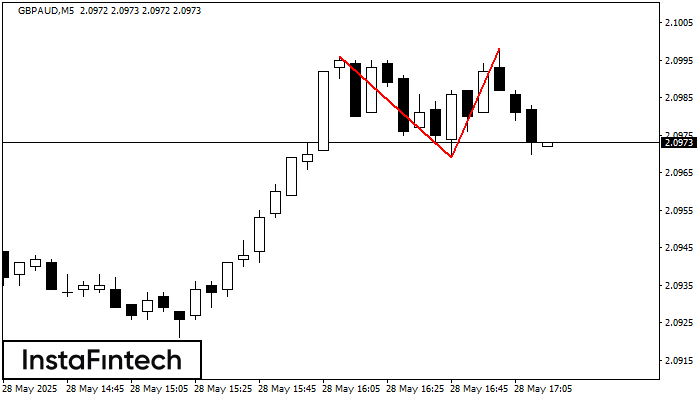
On the chart of GBPAUD M5 the Double Top reversal pattern has been formed. Characteristics: the upper boundary 2.0998; the lower boundary 2.0969; the width of the pattern 29 points
The M5 and M15 time frames may have more false entry points.
Open chart in a new window