Pola sebenarnya

Bullish Rectangle
was formed on 17.04 at 21:45:00 (UTC+0)
signal strength 1 of 5
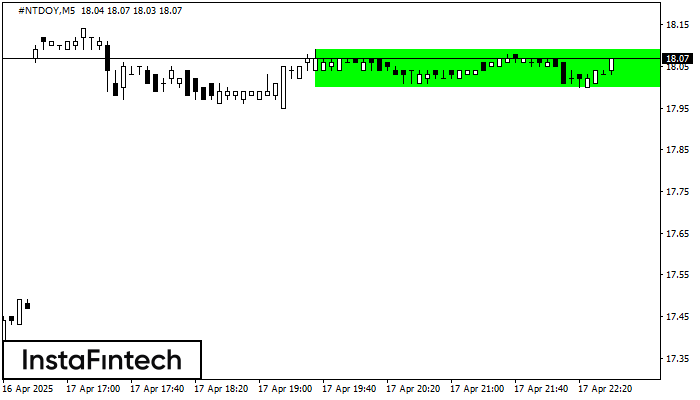
According to the chart of M5, #NTDOY formed the Bullish Rectangle. The pattern indicates a trend continuation. The upper border is 18.09, the lower border is 18.00. The signal means that a long position should be opened above the upper border 18.09 of the Bullish Rectangle.
The M5 and M15 time frames may have more false entry points.
- All
- All
- Bearish Rectangle
- Bearish Symmetrical Triangle
- Bearish Symmetrical Triangle
- Bullish Rectangle
- Double Top
- Double Top
- Triple Bottom
- Triple Bottom
- Triple Top
- Triple Top
- All
- All
- Buy
- Sale
- All
- 1
- 2
- 3
- 4
- 5
Head and Shoulders
was formed on 28.05 at 20:45:31 (UTC+0)
signal strength 1 of 5
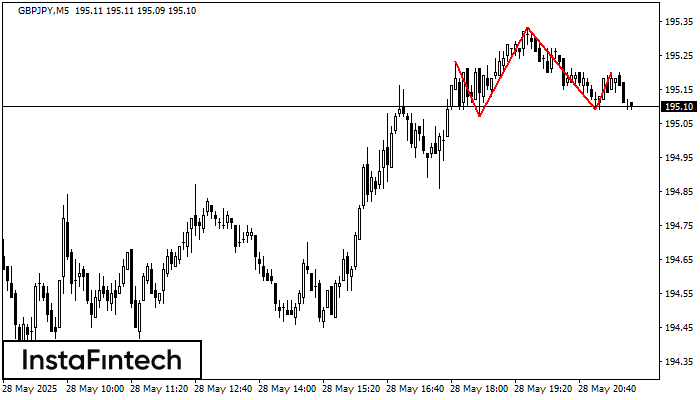
According to the chart of M5, GBPJPY formed the Head and Shoulders pattern. The Head’s top is set at 195.33 while the median line of the Neck is found
The M5 and M15 time frames may have more false entry points.
Open chart in a new window
Triple Top
was formed on 28.05 at 20:00:38 (UTC+0)
signal strength 1 of 5
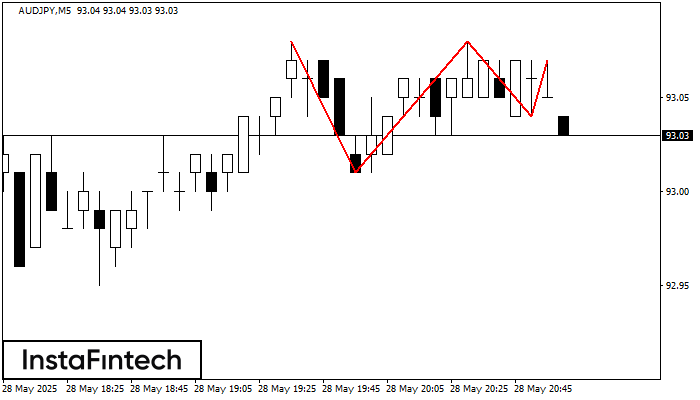
On the chart of the AUDJPY M5 trading instrument, the Triple Top pattern that signals a trend change has formed. It is possible that after formation of the third peak
The M5 and M15 time frames may have more false entry points.
Open chart in a new window
Triple Bottom
was formed on 28.05 at 19:00:32 (UTC+0)
signal strength 1 of 5
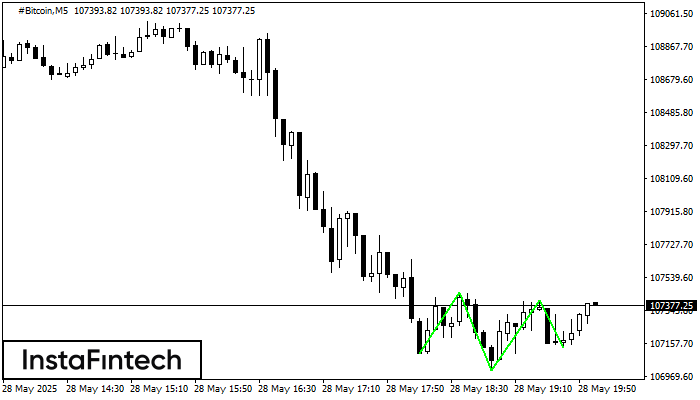
The Triple Bottom pattern has been formed on #Bitcoin M5. It has the following characteristics: resistance level 107451.30/107407.78; support level 107100.45/107133.63; the width is 35085 points. In the event
The M5 and M15 time frames may have more false entry points.
Open chart in a new window