

Pola sebenarnya

Bearish Symmetrical Triangle
was formed on 17.04 at 23:21:25 (UTC+0)
signal strength 1 of 5
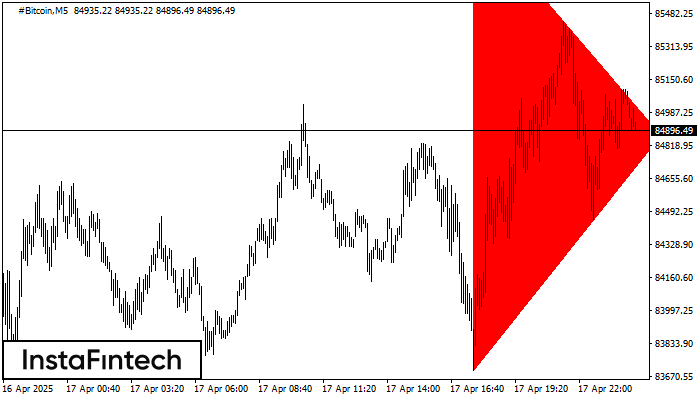
According to the chart of M5, #Bitcoin formed the Bearish Symmetrical Triangle pattern. Description: The lower border is 83699.27/84872.69 and upper border is 85969.60/84872.69. The pattern width is measured on the chart at -227033 pips. The formation of the Bearish Symmetrical Triangle pattern evidently signals a continuation of the downward trend. In other words, if the scenario comes true and #Bitcoin breaches the lower border, the price could continue its move toward 84872.54.
The M5 and M15 time frames may have more false entry points.
- All
- All
- Bearish Rectangle
- Bearish Symmetrical Triangle
- Bearish Symmetrical Triangle
- Bullish Rectangle
- Double Top
- Double Top
- Triple Bottom
- Triple Bottom
- Triple Top
- Triple Top
- All
- All
- Buy
- Sale
- All
- 1
- 2
- 3
- 4
- 5
Bearish Symmetrical Triangle
was formed on 30.04 at 06:15:48 (UTC+0)
signal strength 1 of 5

According to the chart of M5, USDCHF formed the Bearish Symmetrical Triangle pattern. This pattern signals a further downward trend in case the lower border 0.8226 is breached. Here
The M5 and M15 time frames may have more false entry points.
Open chart in a new window
Triple Bottom
was formed on 30.04 at 05:45:24 (UTC+0)
signal strength 1 of 5

The Triple Bottom pattern has formed on the chart of GBPAUD M5. Features of the pattern: The lower line of the pattern has coordinates 2.0938 with the upper limit 2.0938/2.0931
The M5 and M15 time frames may have more false entry points.
Open chart in a new window
Bearish pennant
was formed on 30.04 at 05:22:56 (UTC+0)
signal strength 2 of 5

The Bearish pennant pattern has formed on the GBPAUD M15 chart. It signals potential continuation of the existing trend. Specifications: the pattern’s bottom has the coordinate of 2.0901; the projection
The M5 and M15 time frames may have more false entry points.
Open chart in a new window


