

Pola sebenarnya

Bullish Symmetrical Triangle
was formed on 17.04 at 23:36:52 (UTC+0)
signal strength 1 of 5

According to the chart of M5, EURJPY formed the Bullish Symmetrical Triangle pattern. Description: This is the pattern of a trend continuation. 161.95 and 161.75 are the coordinates of the upper and lower borders respectively. The pattern width is measured on the chart at 20 pips. Outlook: If the upper border 161.95 is broken, the price is likely to continue its move by 162.01.
The M5 and M15 time frames may have more false entry points.
Lihat juga
- All
- All
- Bearish Rectangle
- Bearish Symmetrical Triangle
- Bearish Symmetrical Triangle
- Bullish Rectangle
- Double Top
- Double Top
- Triple Bottom
- Triple Bottom
- Triple Top
- Triple Top
- All
- All
- Buy
- Sale
- All
- 1
- 2
- 3
- 4
- 5
Double Top
was formed on 29.05 at 07:06:52 (UTC+0)
signal strength 1 of 5
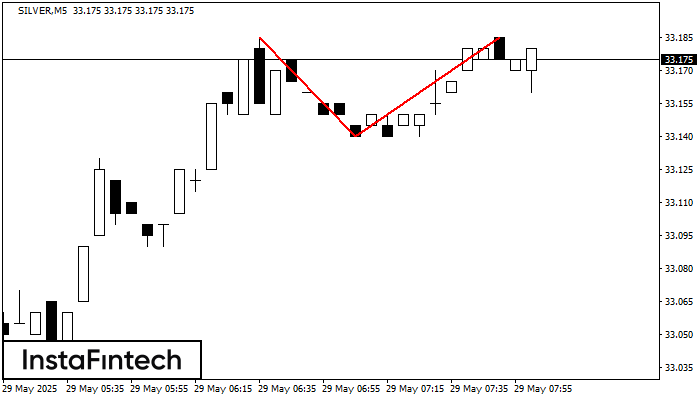
The Double Top reversal pattern has been formed on SILVER M5. Characteristics: the upper boundary 33.19; the lower boundary 33.14; the width of the pattern is 45 points. Sell trades
The M5 and M15 time frames may have more false entry points.
Open chart in a new window
Double Bottom
was formed on 29.05 at 05:19:51 (UTC+0)
signal strength 1 of 5
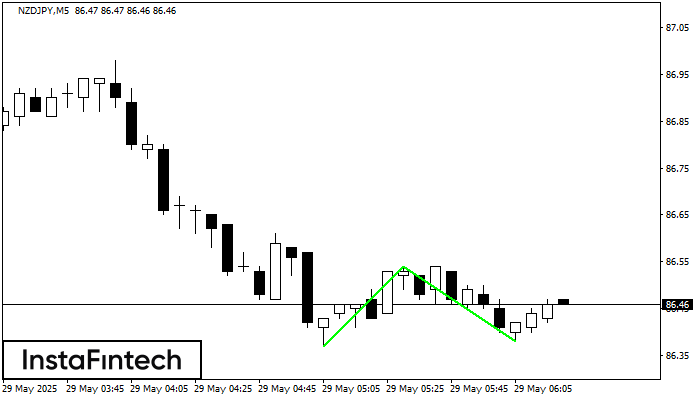
The Double Bottom pattern has been formed on NZDJPY M5. Characteristics: the support level 86.37; the resistance level 86.54; the width of the pattern 17 points. If the resistance level
The M5 and M15 time frames may have more false entry points.
Open chart in a new window
Double Top
was formed on 29.05 at 03:41:06 (UTC+0)
signal strength 1 of 5
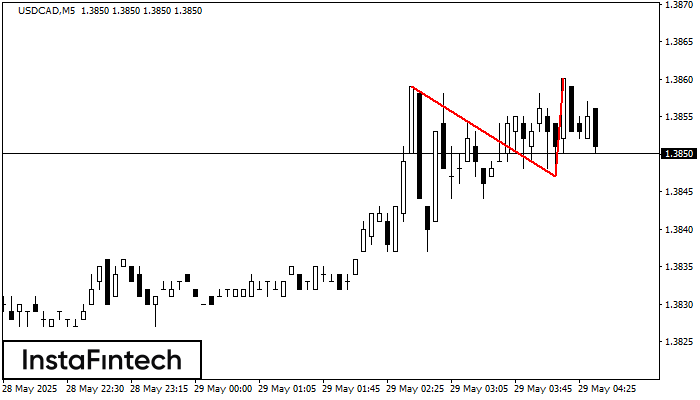
The Double Top reversal pattern has been formed on USDCAD M5. Characteristics: the upper boundary 1.3859; the lower boundary 1.3847; the width of the pattern is 13 points. Sell trades
The M5 and M15 time frames may have more false entry points.
Open chart in a new window


