वास्तविक पैटर्न

पैटर्न ग्राफिकल मॉडल हैं जो चार्ट में मूल्य से बने होते हैं। तकनीकी विश्लेषण भविष्यवाणियों में से एक के अनुसार, इतिहास का मतलब मूल्य आंदोलन खुद को दोहराता है। इसका मतलब है कि मूल्य आंदोलन अक्सर एक ही परिस्थितियों में समान होते हैं जो उच्च संभावना के साथ स्थिति के आगे के विकास की भविष्यवाणी करना संभव बनाता है।
इंस्टा फॉरेक्स द्वारा प्रासंगिक पैटर्न एक उपयोग में आसान सेवा है जो आपको बाजार में नवीनतम परिवर्तनों के बारे में जागरूक होने और समय पर बाजार से संकेतों पर प्रतिक्रिया करने की अनुमति देती है। हमारी सेवा में आप हमेशा किसी भी जोड़ी और किसी भी समय सीमा पर नवीनतम और सबसे प्रासंगिक पैटर्न प्राप्त कर सकते हैं.
Bullish Rectangle
was formed on 01.04 at 21:01:49 (UTC+0)
signal strength 2 of 5
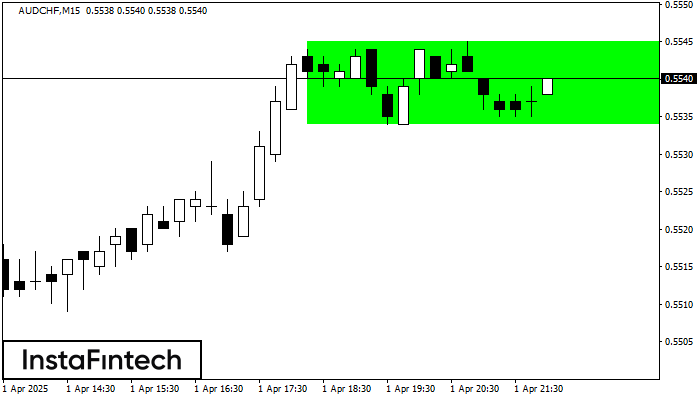
According to the chart of M15, AUDCHF formed the Bullish Rectangle. This type of a pattern indicates a trend continuation. It consists of two levels: resistance 0.5545 and support 0.5534. In case the resistance level 0.5545 - 0.5545 is broken, the instrument is likely to follow the bullish trend.
The M5 and M15 time frames may have more false entry points.
- All
- All
- Bearish Rectangle
- Bearish Symmetrical Triangle
- Bearish Symmetrical Triangle
- Bullish Rectangle
- Double Top
- Double Top
- Triple Bottom
- Triple Bottom
- Triple Top
- Triple Top
- All
- All
- Buy
- Sale
- All
- 1
- 2
- 3
- 4
- 5
ट्रिपल बॉटम
was formed on 25.05 at 15:59:45 (UTC+0)
signal strength 4 of 5

ट्रिपल बॉटम पैटर्न #Bitcoin H1 ट्रेडिंग इंस्ट्रूमेंट के चार्ट पर बना है। 109440.14/108246.73 के टूटने की स्थिति में पैटर्न नीचे से ऊपर की ओर के ट्रेंड में बदलाव का संकेत
Open chart in a new window
डबल बॉटम
was formed on 25.05 at 12:20:13 (UTC+0)
signal strength 1 of 5

डबल बॉटम पैटर्न #Bitcoin M5 पर बना है। विशेषताएं: समर्थन स्तर 106888.42; प्रतिरोध स्तर 107214.56; पैटर्न की चौड़ाई 32614 पॉइंट्स। यदि प्रतिरोध स्तर टूट जाता है, तो रुझान में बदलाव
M5 और M15 समय सीमा में अधिक फाल्स एंट्री पॉइंट्स हो सकते हैं।
Open chart in a new window
बुलिश आयत
was formed on 25.05 at 07:55:30 (UTC+0)
signal strength 1 of 5

M5 के चार्ट के अनुसार, #Bitcoin से बुलिश आयत बना जो एक प्रवृत्ति निरंतरता का पैटर्न है। पैटर्न निम्न सीमाओं के भीतर समाहित है: निचली सीमा 107891.05 – 107891.05
M5 और M15 समय सीमा में अधिक फाल्स एंट्री पॉइंट्स हो सकते हैं।
Open chart in a new window