Bearish Symmetrical Triangle
was formed on 07.04 at 18:10:22 (UTC+0)
signal strength 1 of 5

According to the chart of M5, #MCD formed the Bearish Symmetrical Triangle pattern. Description: The lower border is 290.72/297.52 and upper border is 306.36/297.52. The pattern width is measured on the chart at -1564 pips. The formation of the Bearish Symmetrical Triangle pattern evidently signals a continuation of the downward trend. In other words, if the scenario comes true and #MCD breaches the lower border, the price could continue its move toward 297.37.
The M5 and M15 time frames may have more false entry points.
See Also
- All
- All
- Bearish Rectangle
- Bearish Symmetrical Triangle
- Bearish Symmetrical Triangle
- Bullish Rectangle
- Double Top
- Double Top
- Triple Bottom
- Triple Bottom
- Triple Top
- Triple Top
- All
- All
- Buy
- Sale
- All
- 1
- 2
- 3
- 4
- 5
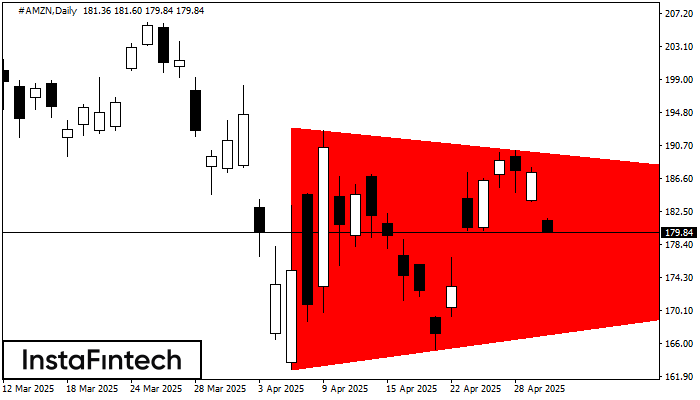
बियरिश सिमेट्रिकल त्रिभुज
was formed on 30.04 at 15:41:07 (UTC+0)
signal strength 5 of 5
D1 के चार्ट के अनुसार, #AMZN से बियरिश सिमेट्रिकल त्रिभुज पैटर्न बना। निचली सीमा 162.77 भंग होने की स्थिति में यह पैटर्न और नीचे के ट्रेंड की ओर संकेत करता
Open chart in a new window
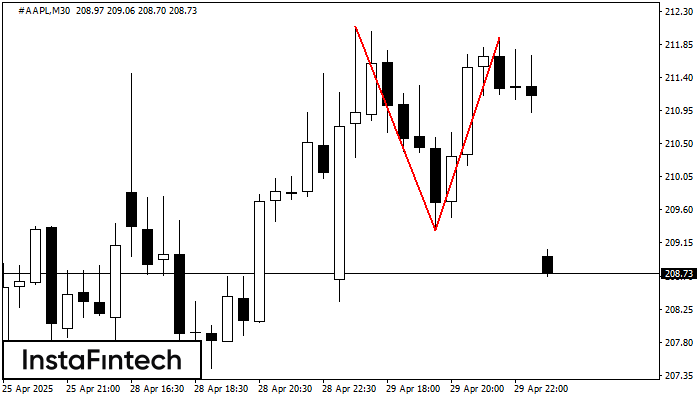
डबल टॉप
was formed on 30.04 at 15:30:25 (UTC+0)
signal strength 3 of 5
डबल टॉप पैटर्न #AAPL M30 पर बना है। यह संकेत देता है कि प्रवृत्ति ऊपर से नीचे की ओर बदल गई है। संभवतः, यदि 209.32 पैटर्न का आधार टूट जाता
Open chart in a new window
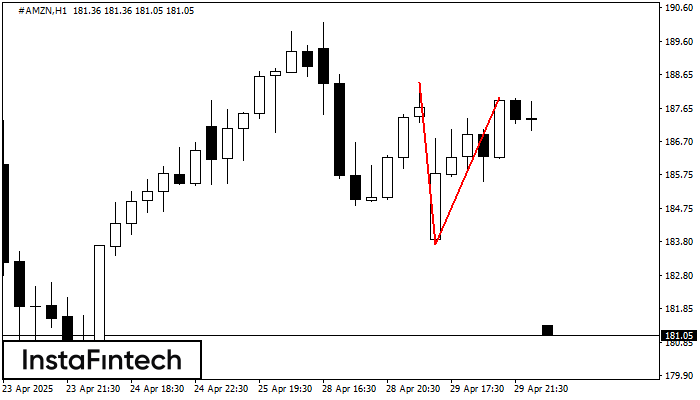
डबल टॉप
was formed on 30.04 at 15:30:24 (UTC+0)
signal strength 4 of 5
#AMZN H1 पर डबल टॉप रीवर्सल पैटर्न बना है। विशेषताएं: ऊपरी सीमा 188.42; निचली सीमा 183.71; पैटर्न की चौड़ाई 426 पॉइंट्स है। सेल ट्रेडों को 183.71 की निचली सीमा के
Open chart in a new window


