वास्तविक पैटर्न

पैटर्न ग्राफिकल मॉडल हैं जो चार्ट में मूल्य से बने होते हैं। तकनीकी विश्लेषण भविष्यवाणियों में से एक के अनुसार, इतिहास का मतलब मूल्य आंदोलन खुद को दोहराता है। इसका मतलब है कि मूल्य आंदोलन अक्सर एक ही परिस्थितियों में समान होते हैं जो उच्च संभावना के साथ स्थिति के आगे के विकास की भविष्यवाणी करना संभव बनाता है।
इंस्टा फॉरेक्स द्वारा प्रासंगिक पैटर्न एक उपयोग में आसान सेवा है जो आपको बाजार में नवीनतम परिवर्तनों के बारे में जागरूक होने और समय पर बाजार से संकेतों पर प्रतिक्रिया करने की अनुमति देती है। हमारी सेवा में आप हमेशा किसी भी जोड़ी और किसी भी समय सीमा पर नवीनतम और सबसे प्रासंगिक पैटर्न प्राप्त कर सकते हैं.
Bullish Symmetrical Triangle
was formed on 17.04 at 03:06:49 (UTC+0)
signal strength 3 of 5

According to the chart of M30, EURNZD formed the Bullish Symmetrical Triangle pattern. Description: This is the pattern of a trend continuation. 1.9252 and 1.9161 are the coordinates of the upper and lower borders respectively. The pattern width is measured on the chart at 91 pips. Outlook: If the upper border 1.9252 is broken, the price is likely to continue its move by 1.9237.
- All
- All
- Bearish Rectangle
- Bearish Symmetrical Triangle
- Bearish Symmetrical Triangle
- Bullish Rectangle
- Double Top
- Double Top
- Triple Bottom
- Triple Bottom
- Triple Top
- Triple Top
- All
- All
- Buy
- Sale
- All
- 1
- 2
- 3
- 4
- 5
ट्रिपल टॉप
was formed on 27.05 at 23:15:37 (UTC+0)
signal strength 2 of 5
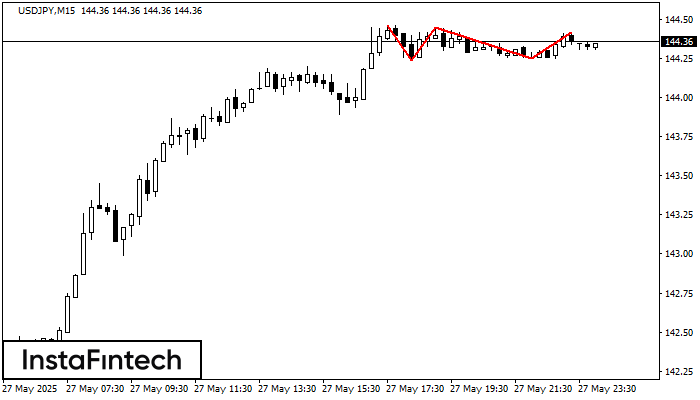
ट्रिपल टॉप पैटर्न USDJPY M15 ट्रेडिंग इंस्ट्रूमेंट के चार्ट पर बना है। यह एक रीवर्सल पैटर्न है जिसमें निम्नलिखित विशेषताएं हैं: प्रतिरोध स्तर 4, समर्थन स्तर -1, और पैटर्न की
M5 और M15 समय सीमा में अधिक फाल्स एंट्री पॉइंट्स हो सकते हैं।
Open chart in a new window
बियरिश आयत
was formed on 27.05 at 22:51:51 (UTC+0)
signal strength 3 of 5
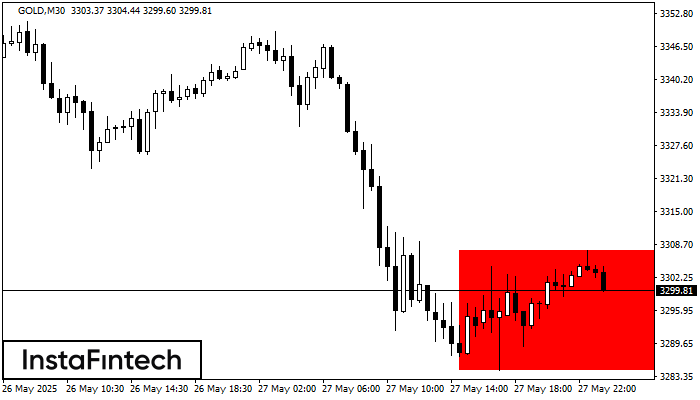
M30 के चार्ट के अनुसार, GOLD से बियरिश आयत बना जो प्रवृत्ति निरंतरता का पैटर्न है। पैटर्न निम्न सीमाओं के भीतर समाहित है: निचली सीमा 3284.62 – 3284.62 और ऊपरी
Open chart in a new window
डबल बॉटम
was formed on 27.05 at 22:50:17 (UTC+0)
signal strength 1 of 5
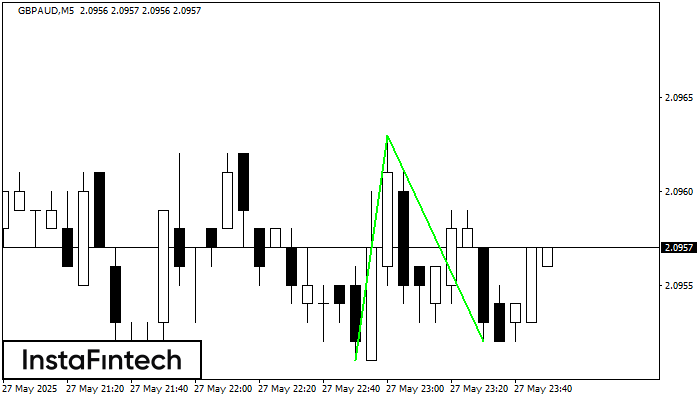
डबल बॉटम पैटर्न GBPAUD M5 पर बना है; ऊपरी सीमा 2.0963 है; निचली सीमा 2.0952 है। पैटर्न की चौड़ाई 12 अंक है। ऊपरी सीमा 2.0963 के टूटने के मामले में
M5 और M15 समय सीमा में अधिक फाल्स एंट्री पॉइंट्स हो सकते हैं।
Open chart in a new window