वास्तविक पैटर्न

पैटर्न ग्राफिकल मॉडल हैं जो चार्ट में मूल्य से बने होते हैं। तकनीकी विश्लेषण भविष्यवाणियों में से एक के अनुसार, इतिहास का मतलब मूल्य आंदोलन खुद को दोहराता है। इसका मतलब है कि मूल्य आंदोलन अक्सर एक ही परिस्थितियों में समान होते हैं जो उच्च संभावना के साथ स्थिति के आगे के विकास की भविष्यवाणी करना संभव बनाता है।
इंस्टा फॉरेक्स द्वारा प्रासंगिक पैटर्न एक उपयोग में आसान सेवा है जो आपको बाजार में नवीनतम परिवर्तनों के बारे में जागरूक होने और समय पर बाजार से संकेतों पर प्रतिक्रिया करने की अनुमति देती है। हमारी सेवा में आप हमेशा किसी भी जोड़ी और किसी भी समय सीमा पर नवीनतम और सबसे प्रासंगिक पैटर्न प्राप्त कर सकते हैं.
Inverse Head and Shoulder
was formed on 17.04 at 17:44:51 (UTC+0)
signal strength 1 of 5
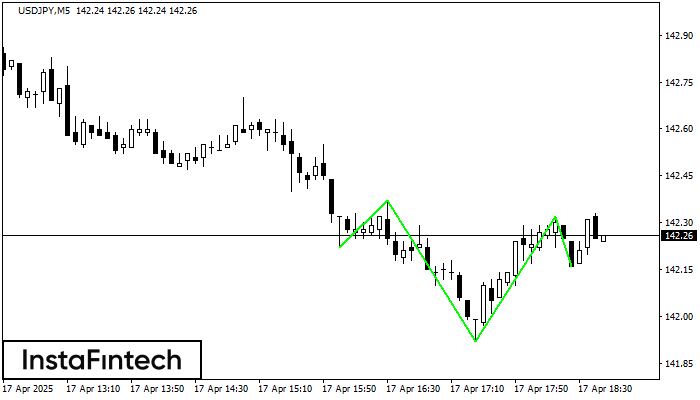
According to the chart of M5, USDJPY produced the pattern termed the Inverse Head and Shoulder. The Head is fixed at 141.92 while the median line of the Neck is set at 142.37/142.32. The formation of the Inverse Head and Shoulder Pattern clearly indicates a reversal of the downward trend. In means that in case the scenario comes true, the price of USDJPY will go towards 142.47.
The M5 and M15 time frames may have more false entry points.
- All
- All
- Bearish Rectangle
- Bearish Symmetrical Triangle
- Bearish Symmetrical Triangle
- Bullish Rectangle
- Double Top
- Double Top
- Triple Bottom
- Triple Bottom
- Triple Top
- Triple Top
- All
- All
- Buy
- Sale
- All
- 1
- 2
- 3
- 4
- 5
इन्वर्स हेड एण्ड शोल्डर्स
was formed on 26.05 at 01:00:29 (UTC+0)
signal strength 2 of 5
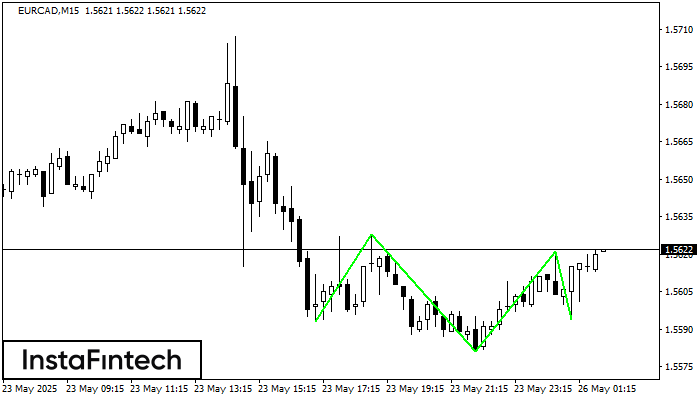
M15 के चार्ट के अनुसार, EURCAD से इन्वर्स हेड एण्ड शोल्डर्स पैटर्न बना। हेड 1.5581 पर स्थित है जबकि नेक की मध्य रेखा 1.5628/1.5621 पर सेट है। इन्वर्स हेड एण्ड
M5 और M15 समय सीमा में अधिक फाल्स एंट्री पॉइंट्स हो सकते हैं।
Open chart in a new window
बियरिश पताका
was formed on 26.05 at 00:19:29 (UTC+0)
signal strength 1 of 5
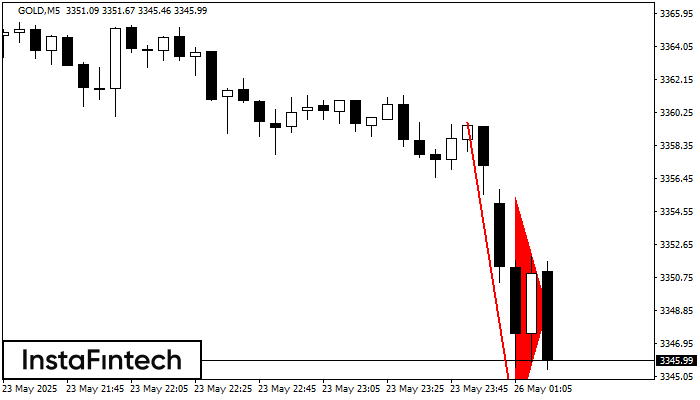
बियरिश पताका पैटर्न GOLD M5 चार्ट पर बना है। यदि पताका का 3342.42 निम्न स्तर टूट जाता है, तो पैटर्न डाउनट्रेंड के जारी रहने का संकेत देता है। अनुशंसाएं: पैटर्न
M5 और M15 समय सीमा में अधिक फाल्स एंट्री पॉइंट्स हो सकते हैं।
Open chart in a new window
बुलिश आयत
was formed on 25.05 at 23:51:24 (UTC+0)
signal strength 1 of 5
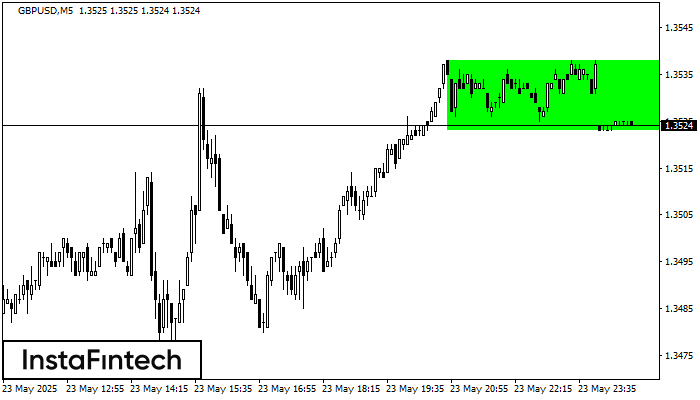
M5 के चार्ट के अनुसार, GBPUSD से बुलिश आयत बना जो एक प्रवृत्ति निरंतरता का पैटर्न है। पैटर्न निम्न सीमाओं के भीतर समाहित है: निचली सीमा 1.3523 – 1.3523
M5 और M15 समय सीमा में अधिक फाल्स एंट्री पॉइंट्स हो सकते हैं।
Open chart in a new window