वास्तविक पैटर्न

पैटर्न ग्राफिकल मॉडल हैं जो चार्ट में मूल्य से बने होते हैं। तकनीकी विश्लेषण भविष्यवाणियों में से एक के अनुसार, इतिहास का मतलब मूल्य आंदोलन खुद को दोहराता है। इसका मतलब है कि मूल्य आंदोलन अक्सर एक ही परिस्थितियों में समान होते हैं जो उच्च संभावना के साथ स्थिति के आगे के विकास की भविष्यवाणी करना संभव बनाता है।
इंस्टा फॉरेक्स द्वारा प्रासंगिक पैटर्न एक उपयोग में आसान सेवा है जो आपको बाजार में नवीनतम परिवर्तनों के बारे में जागरूक होने और समय पर बाजार से संकेतों पर प्रतिक्रिया करने की अनुमति देती है। हमारी सेवा में आप हमेशा किसी भी जोड़ी और किसी भी समय सीमा पर नवीनतम और सबसे प्रासंगिक पैटर्न प्राप्त कर सकते हैं.
Bearish Symmetrical Triangle
was formed on 17.04 at 23:30:07 (UTC+0)
signal strength 1 of 5

According to the chart of M5, USDCHF formed the Bearish Symmetrical Triangle pattern. Description: The lower border is 0.8182/0.8188 and upper border is 0.8195/0.8188. The pattern width is measured on the chart at -13 pips. The formation of the Bearish Symmetrical Triangle pattern evidently signals a continuation of the downward trend. In other words, if the scenario comes true and USDCHF breaches the lower border, the price could continue its move toward 0.8173.
The M5 and M15 time frames may have more false entry points.
- All
- All
- Bearish Rectangle
- Bearish Symmetrical Triangle
- Bearish Symmetrical Triangle
- Bullish Rectangle
- Double Top
- Double Top
- Triple Bottom
- Triple Bottom
- Triple Top
- Triple Top
- All
- All
- Buy
- Sale
- All
- 1
- 2
- 3
- 4
- 5
Bearish pennant
was formed on 28.05 at 04:02:50 (UTC+0)
signal strength 1 of 5
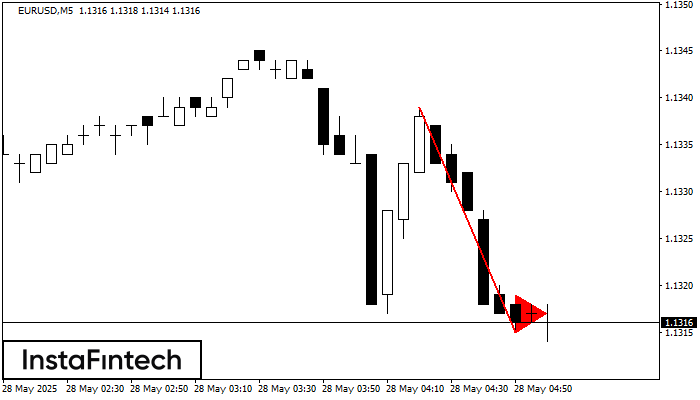
The Bearish pennant pattern has formed on the EURUSD M5 chart. The pattern signals continuation of the downtrend in case the pennant’s low of 1.1315 is broken through. Recommendations: Place
The M5 and M15 time frames may have more false entry points.
Open chart in a new window
Bullish Rectangle
was formed on 28.05 at 03:30:25 (UTC+0)
signal strength 2 of 5
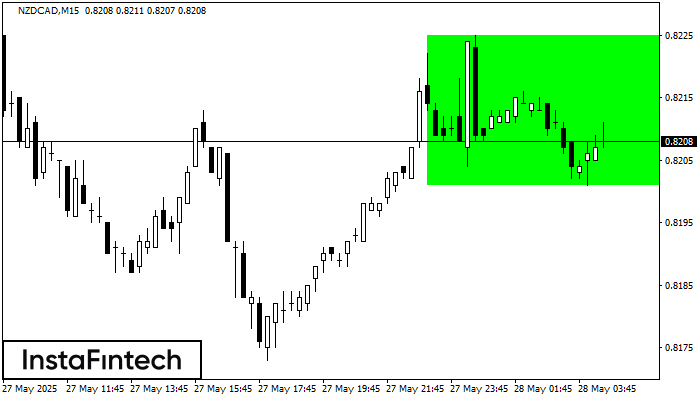
According to the chart of M15, NZDCAD formed the Bullish Rectangle. This type of a pattern indicates a trend continuation. It consists of two levels: resistance 0.8225 and support 0.8201
The M5 and M15 time frames may have more false entry points.
Open chart in a new window
Triple Top
was formed on 28.05 at 03:01:28 (UTC+0)
signal strength 3 of 5
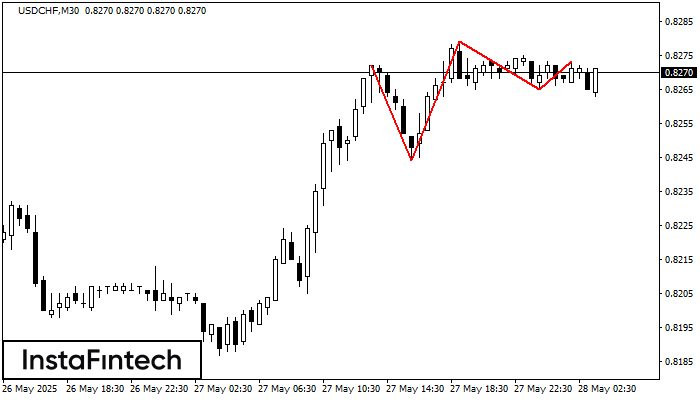
The Triple Top pattern has formed on the chart of the USDCHF M30 trading instrument. It is a reversal pattern featuring the following characteristics: resistance level -1, support level -21
Open chart in a new window