Өзекті паттерндер

Бычий симметричный треугольник
сформирован 16.04 в 17:01:05 (UTC+0)
сила сигнала 4 из 5
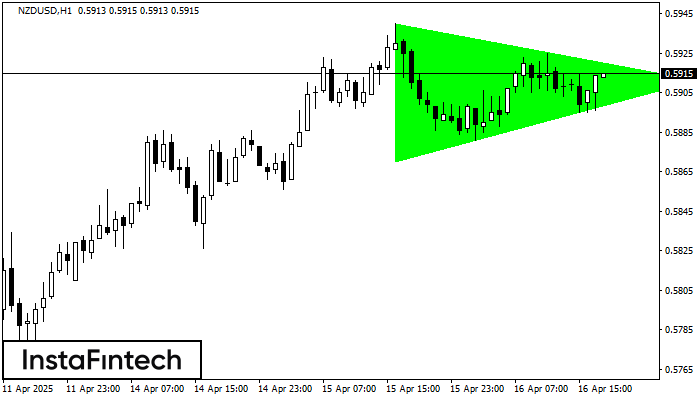
По NZDUSD на H1 сформировалась фигура «Бычий симметричный треугольник», которая сигнализирует нам о продолжении тенденции. Характеристика: Верхняя граница фигуры имеет координаты 0.5940/0.5911; Нижняя граница 0.5870/0.5911; Проекция ширины фигуры 70 пунктов. Формирование фигуры «Бычий симметричный треугольник» на восходящем тренде свидетельствует о продолжении текущего движения, где, в случае пробоя значения 0.5911, возможно движение к 0.5951.
- Все
- Все
- Bearish Rectangle
- Bearish Symmetrical Triangle
- Bearish Symmetrical Triangle
- Bullish Rectangle
- Double Top
- Double Top
- Triple Bottom
- Triple Bottom
- Triple Top
- Triple Top
- Все
- Все
- Покупка
- Продажа
- Все
- 1
- 2
- 3
- 4
- 5
Bearish Rectangle
was formed on 30.05 at 15:34:48 (UTC+0)
signal strength 2 of 5
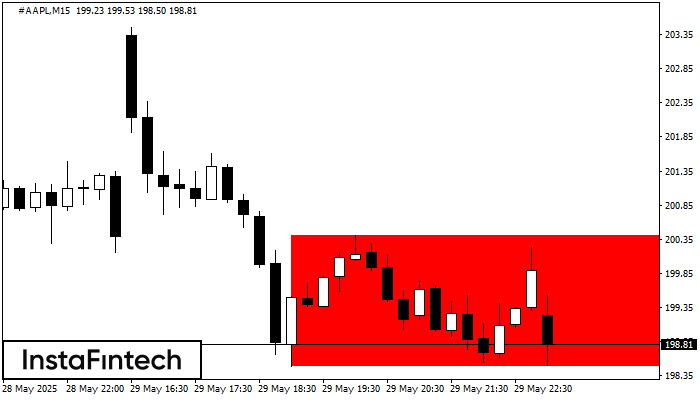
According to the chart of M15, #AAPL formed the Bearish Rectangle. The pattern indicates a trend continuation. The upper border is 200.40, the lower border is 198.49. The signal means
The M5 and M15 time frames may have more false entry points.
Open chart in a new window
Double Bottom
was formed on 30.05 at 15:30:16 (UTC+0)
signal strength 2 of 5
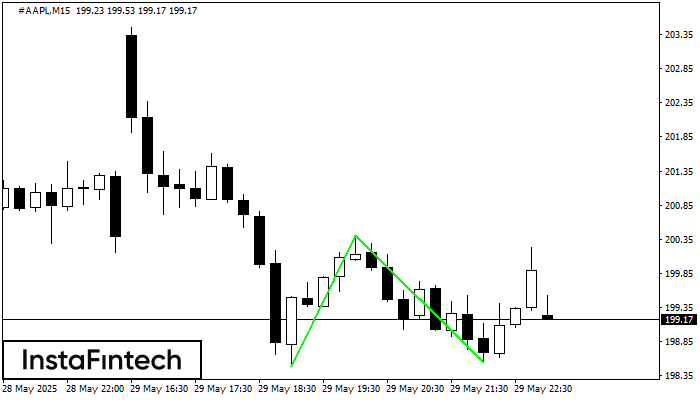
The Double Bottom pattern has been formed on #AAPL M15. Characteristics: the support level 198.49; the resistance level 200.40; the width of the pattern 191 points. If the resistance level
The M5 and M15 time frames may have more false entry points.
Open chart in a new window
Inverse Head and Shoulder
was formed on 30.05 at 15:25:34 (UTC+0)
signal strength 1 of 5
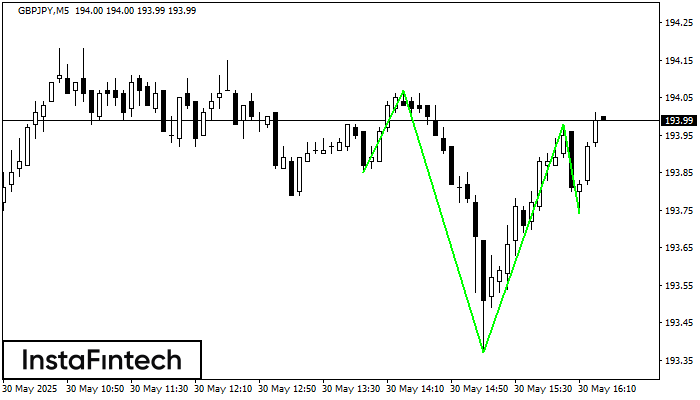
According to M5, GBPJPY is shaping the technical pattern – the Inverse Head and Shoulder. In case the Neckline 194.07/193.98 is broken out, the instrument is likely to move toward
The M5 and M15 time frames may have more false entry points.
Open chart in a new window