Өзекті паттерндер

Медвежий симметричный треугольник
сформирован 17.04 в 13:57:41 (UTC+0)
сила сигнала 3 из 5

По EURUSD M30 сформировалась фигура «Медвежий симметричный треугольник». Данная фигура сигнализирует нам о продолжении нисходящего тренда в случае пробоя нижней границы 1.1264, где вероятная прибыль будет являться шириной текущей фигуры -195 пунктов.
- Все
- Все
- Bearish Rectangle
- Bearish Symmetrical Triangle
- Bearish Symmetrical Triangle
- Bullish Rectangle
- Double Top
- Double Top
- Triple Bottom
- Triple Bottom
- Triple Top
- Triple Top
- Все
- Все
- Покупка
- Продажа
- Все
- 1
- 2
- 3
- 4
- 5
Bullish Symmetrical Triangle
was formed on 30.04 at 13:01:32 (UTC+0)
signal strength 1 of 5
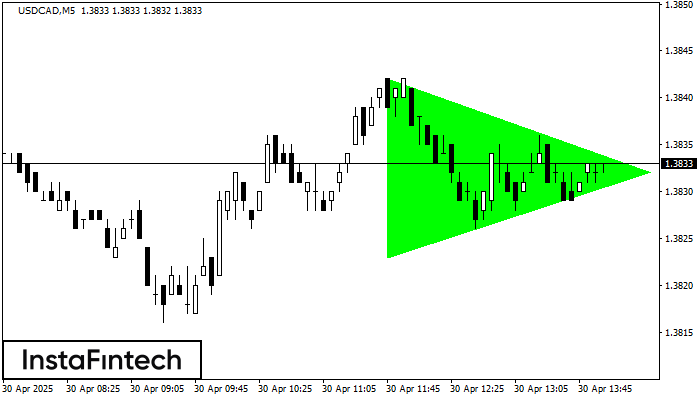
According to the chart of M5, USDCAD formed the Bullish Symmetrical Triangle pattern. The lower border of the pattern touches the coordinates 1.3823/1.3832 whereas the upper border goes across 1.3842/1.3832
The M5 and M15 time frames may have more false entry points.
Open chart in a new window
Triple Bottom
was formed on 30.04 at 12:55:28 (UTC+0)
signal strength 1 of 5
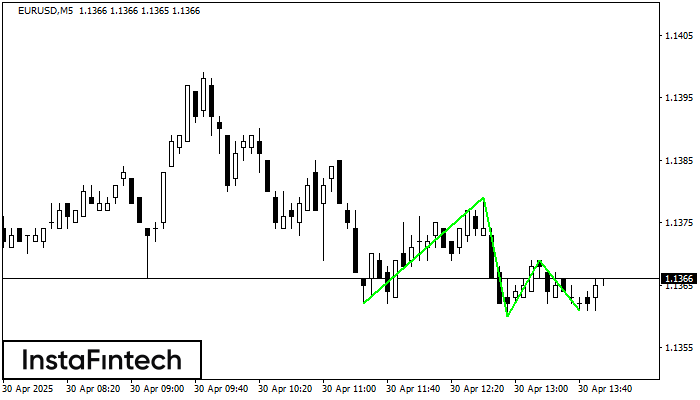
The Triple Bottom pattern has formed on the chart of EURUSD M5. Features of the pattern: The lower line of the pattern has coordinates 1.1379 with the upper limit 1.1379/1.1369
The M5 and M15 time frames may have more false entry points.
Open chart in a new window
Bearish Symmetrical Triangle
was formed on 30.04 at 12:39:02 (UTC+0)
signal strength 1 of 5
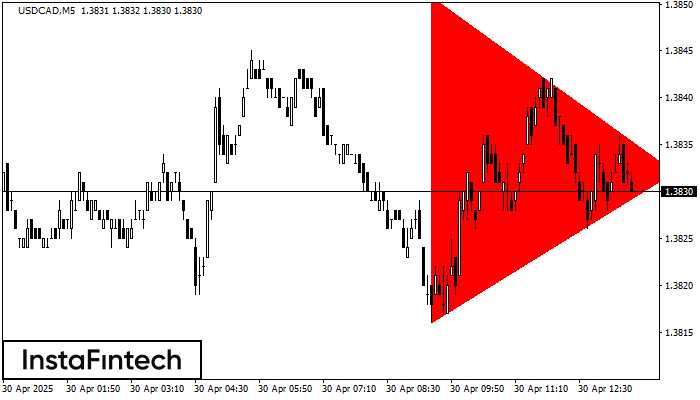
According to the chart of M5, USDCAD formed the Bearish Symmetrical Triangle pattern. Description: The lower border is 1.3816/1.3832 and upper border is 1.3851/1.3832. The pattern width is measured
The M5 and M15 time frames may have more false entry points.
Open chart in a new window