

Өзекті паттерндер

Двойное дно
сформирован 17.04 в 15:29:57 (UTC+0)
сила сигнала 2 из 5

Сформирована фигура «Двойное дно» на графике #EBAY M15. Верхняя граница 67.35; Нижняя граница 65.16; Ширина фигуры 215 пунктов. В случае пробоя верхней границы 67.35 можно будет прогнозировать изменение тенденции, где ширина фигуры и будет являться расстоянием предположительного Тейк Профита.
Таймфреймы М5 и М15 могут иметь больше ложных точек входа.
- Все
- Все
- Bearish Rectangle
- Bearish Symmetrical Triangle
- Bearish Symmetrical Triangle
- Bullish Rectangle
- Double Top
- Double Top
- Triple Bottom
- Triple Bottom
- Triple Top
- Triple Top
- Все
- Все
- Покупка
- Продажа
- Все
- 1
- 2
- 3
- 4
- 5
Bullish Rectangle
was formed on 30.04 at 11:35:30 (UTC+0)
signal strength 1 of 5
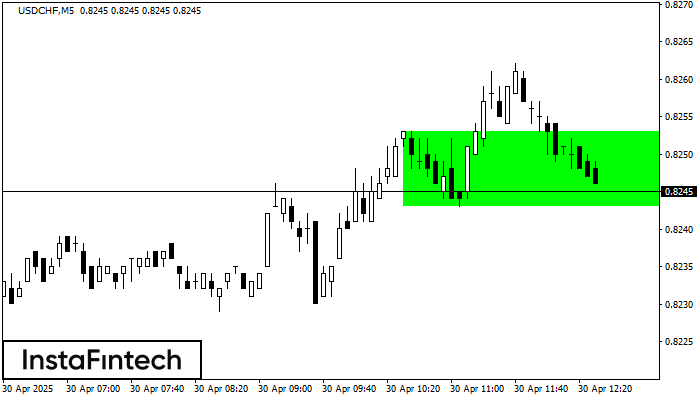
According to the chart of M5, USDCHF formed the Bullish Rectangle. The pattern indicates a trend continuation. The upper border is 0.8253, the lower border is 0.8243. The signal means
The M5 and M15 time frames may have more false entry points.
Open chart in a new window
Bearish Rectangle
was formed on 30.04 at 11:31:41 (UTC+0)
signal strength 1 of 5
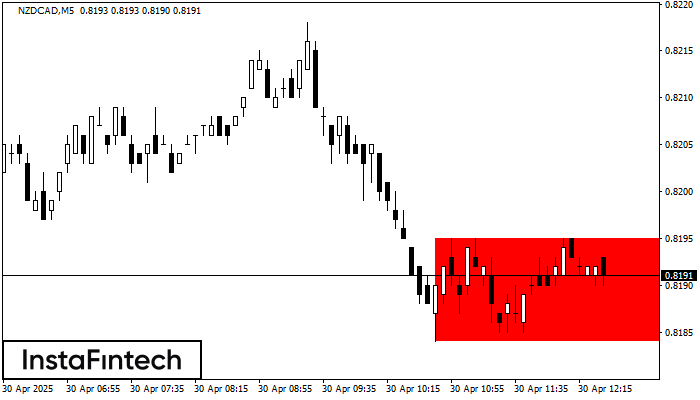
According to the chart of M5, NZDCAD formed the Bearish Rectangle which is a pattern of a trend continuation. The pattern is contained within the following borders: lower border 0.8184
The M5 and M15 time frames may have more false entry points.
Open chart in a new window
Bullish Rectangle
was formed on 30.04 at 10:57:58 (UTC+0)
signal strength 1 of 5
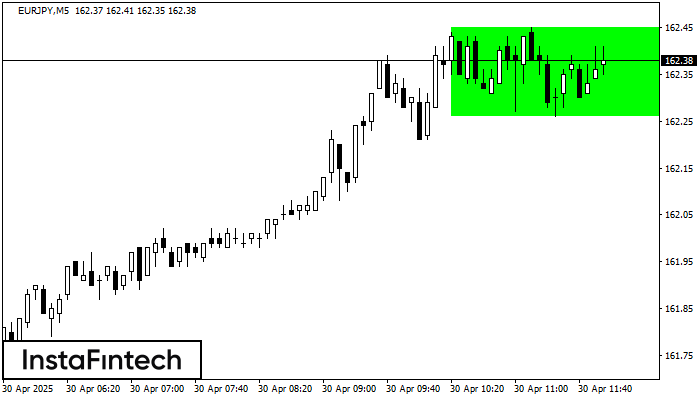
According to the chart of M5, EURJPY formed the Bullish Rectangle. This type of a pattern indicates a trend continuation. It consists of two levels: resistance 162.45 and support 162.26
The M5 and M15 time frames may have more false entry points.
Open chart in a new window


