Өзекті паттерндер

Двойное дно
сформирован 17.04 в 20:20:19 (UTC+0)
сила сигнала 1 из 5

Сформирована фигура «Двойное дно» на графике EURNZD M5. Характеристика: Уровень поддержки 1.8992; Уровень сопротивления 1.9020; Ширина фигуры 28 пунктов. В случае пробоя уровня сопротивления можно будет прогнозировать изменение тенденции, где первая точка фиксации прибыли находится на расстоянии 26 пунктов.
Таймфреймы М5 и М15 могут иметь больше ложных точек входа.
- Все
- Все
- Bearish Rectangle
- Bearish Symmetrical Triangle
- Bearish Symmetrical Triangle
- Bullish Rectangle
- Double Top
- Double Top
- Triple Bottom
- Triple Bottom
- Triple Top
- Triple Top
- Все
- Все
- Покупка
- Продажа
- Все
- 1
- 2
- 3
- 4
- 5
Bearish pennant
сформирован 02.06 в 14:45:11 (UTC+0)
сила сигнала 4 из 5
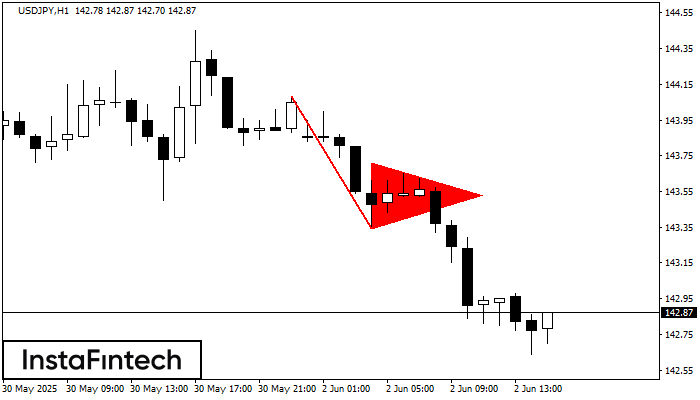
The Bearish pennant pattern has formed on the USDJPY H1 chart. It signals potential continuation of the existing trend. Specifications: the pattern’s bottom has the coordinate of 143.34; the projection
Открыть график инструмента в новом окне
Bullish Rectangle
сформирован 02.06 в 14:35:19 (UTC+0)
сила сигнала 2 из 5
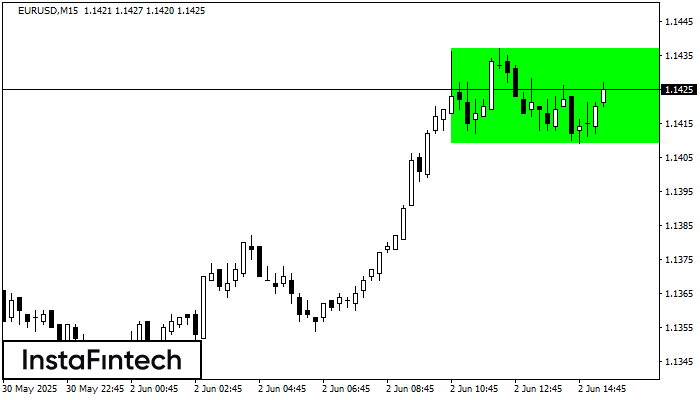
According to the chart of M15, EURUSD formed the Bullish Rectangle which is a pattern of a trend continuation. The pattern is contained within the following borders: the lower border
The M5 and M15 time frames may have more false entry points.
Открыть график инструмента в новом окне
Bullish Rectangle
сформирован 02.06 в 13:16:37 (UTC+0)
сила сигнала 1 из 5
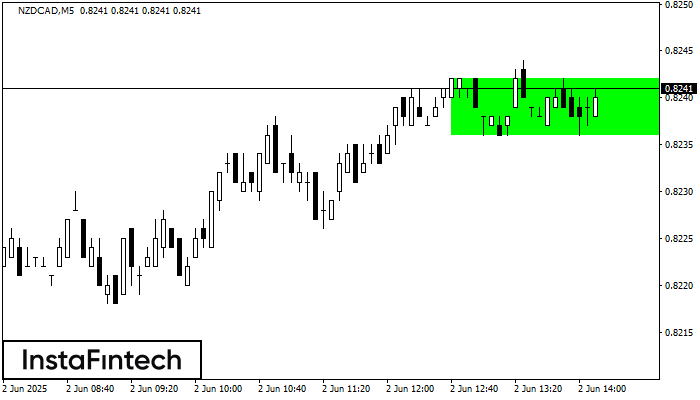
According to the chart of M5, NZDCAD formed the Bullish Rectangle. The pattern indicates a trend continuation. The upper border is 0.8242, the lower border is 0.8236. The signal means
The M5 and M15 time frames may have more false entry points.
Открыть график инструмента в новом окне