Өзекті паттерндер

Двойное дно
сформирован 29.04 в 08:30:03 (UTC+0)
сила сигнала 3 из 5
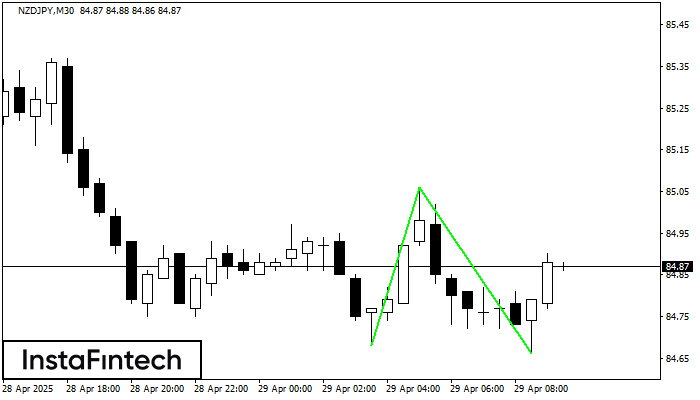
Сформирована фигура «Двойное дно» на графике NZDJPY M30. Данное формирование сигнализирует об изменении тенденции с нисходящего на восходящее движение. Сигнал: Торговую позицию на покупку следует открывать после пробоя верхней границы фигуры 85.06, где перспектива будущего хода будет являться шириной текущей фигуры - 38 пунктов.
- Все
- Все
- Bearish Rectangle
- Bearish Symmetrical Triangle
- Bearish Symmetrical Triangle
- Bullish Rectangle
- Double Top
- Double Top
- Triple Bottom
- Triple Bottom
- Triple Top
- Triple Top
- Все
- Все
- Покупка
- Продажа
- Все
- 1
- 2
- 3
- 4
- 5
Double Top
сформирован 30.05 в 05:50:10 (UTC+0)
сила сигнала 1 из 5
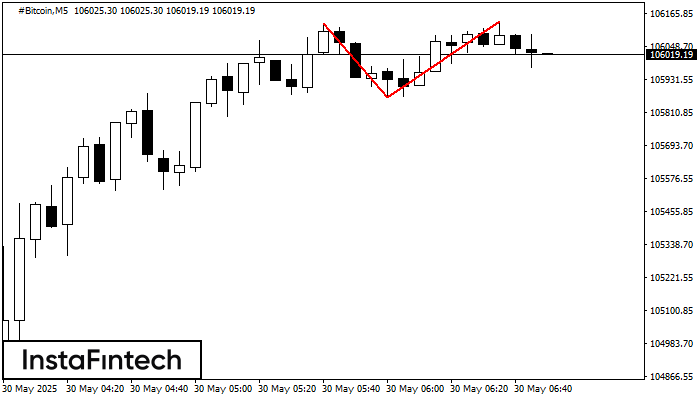
On the chart of #Bitcoin M5 the Double Top reversal pattern has been formed. Characteristics: the upper boundary 106138.63; the lower boundary 105867.53; the width of the pattern 27110 points
The M5 and M15 time frames may have more false entry points.
Открыть график инструмента в новом окне
Bearish Rectangle
сформирован 30.05 в 05:48:51 (UTC+0)
сила сигнала 1 из 5
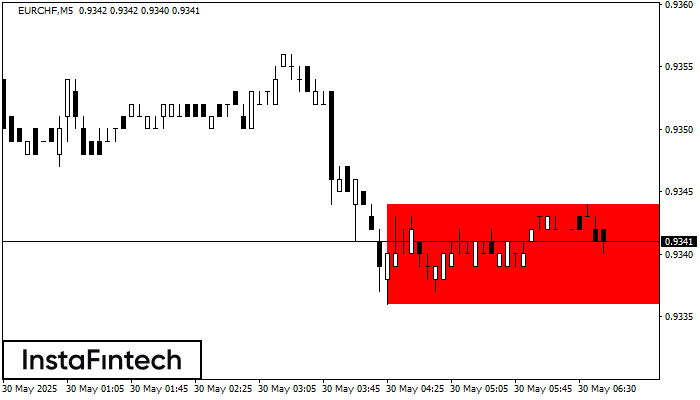
According to the chart of M5, EURCHF formed the Bearish Rectangle. This type of a pattern indicates a trend continuation. It consists of two levels: resistance 0.9344 - 0.0000
The M5 and M15 time frames may have more false entry points.
Открыть график инструмента в новом окне
Bearish Flag
сформирован 30.05 в 05:45:30 (UTC+0)
сила сигнала 2 из 5
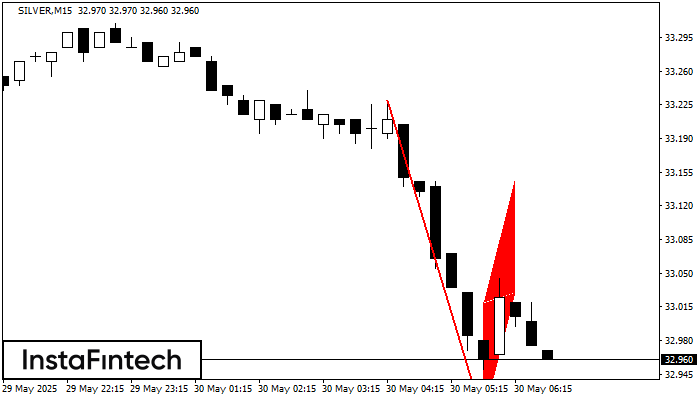
The Bearish Flag pattern has been formed on the chart SILVER M15. Therefore, the downwards trend is likely to continue in the nearest term. As soon as the price breaks
The M5 and M15 time frames may have more false entry points.
Открыть график инструмента в новом окне