Lihat juga


 04.04.2024 02:38 PM
On Thursday, the market observes somewhat contradictory dynamics of the dollar. It weakens in the DXY index, which primarily consists of the euro, but strengthens against safe-haven assets—the yen, franc, and gold.
At the same time, market participants who are in active short positions on the dollar may want to pay attention to the dynamics of U.S. government bond yields, which continue to rise.
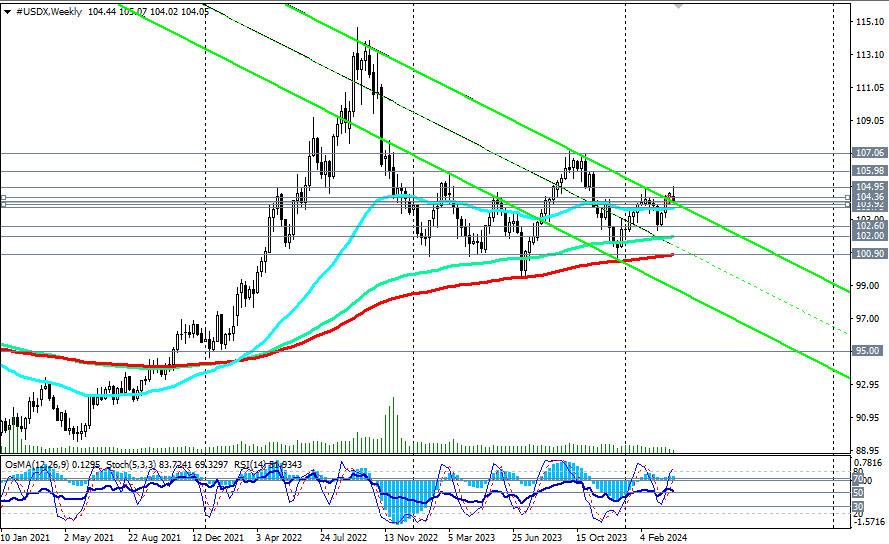
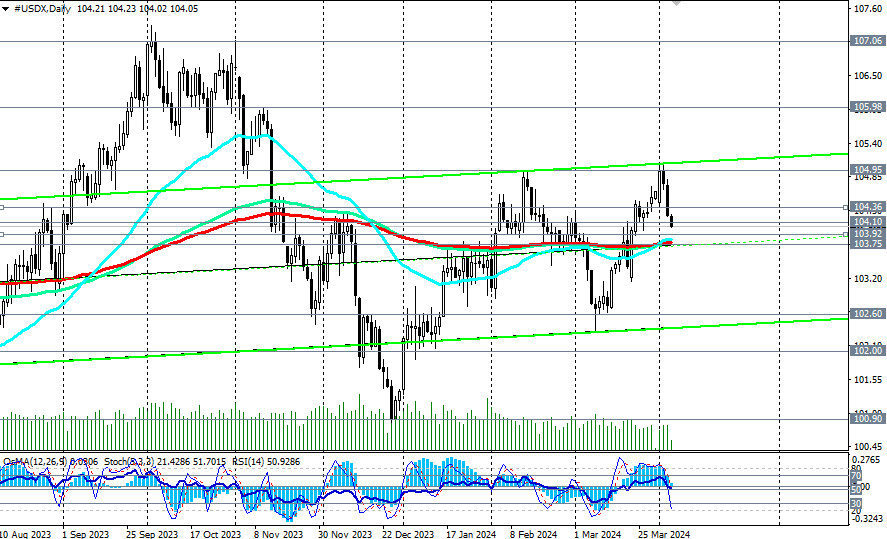
From a technical point of view, the dollar index (CFD #USDX in the MT4 terminal) remains in a bullish market zone, medium-term—above the support level of 103.75 (200 EMA on the daily chart), long-term—above the key support level of 100.90 (200 EMA on the weekly chart).
Therefore, long positions on the dollar index remain preferable for now.
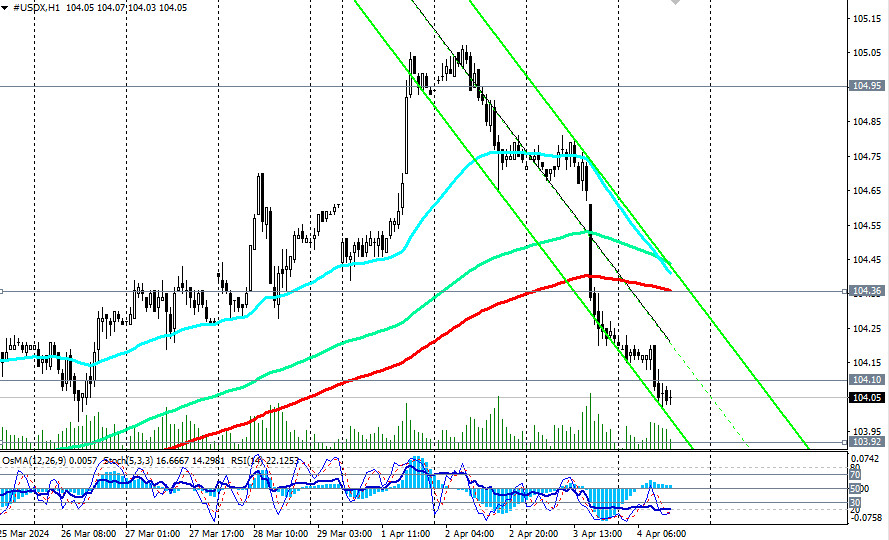
A signal for new purchases could be the breakout of the important short-term resistance level of 104.36 (200 EMA on the 1-hour chart).
In case of a decrease to the support levels of 103.92 (200 EMA on the 4-hour chart) and 103.75 (200 EMA, 144 EMA on the daily chart), it is possible to place pending limit orders for purchase with stops below the 103.60 mark.
In an alternative scenario, after the confirmed breakout of the support level at 103.75, the price may deepen into the downward channel on the weekly chart, with targets at support levels of 102.60 and 102.00 (144 EMA on the weekly chart).
The breakout of the key support level of 100.90 (200 EMA on the weekly chart) will bring the DXY into the long-term bear market zone. The bullish trend of the dollar will be broken.
This scenario may gain momentum if tomorrow's U.S. Labor Department report turns out to be significantly weaker than forecasted. Further dynamics of the dollar and its DXY index will largely depend on the fundamental background and the actions of the Federal Reserve.
Support levels: 104.10, 104.00, 103.92, 103.75, 103.00, 102.60, 102.00, 101.00, 100.90, 100.00
Resistance levels: 104.36, 104.95, 105.00, 106.00, 106.80, 107.00, 107.30
Trading Scenarios
Main scenario: BuyStop 104.40. Stop-Loss 103.60. Targets 104.95, 105.00, 106.00, 106.80, 107.00, 107.30
Alternative scenario: SellStop 103.60. Stop-Loss 104.10. Targets 103.00, 102.60, 102.00, 101.00, 100.90, 100.00
"Targets" correspond to support/resistance levels. This also does not mean that they will necessarily be reached, but they can serve as a guideline for planning and placing your trading positions.
You have already liked this post today
* Analisis pasaran yang disiarkan di sini adalah bertujuan untuk meningkatkan kesedaran anda, tetapi tidak untuk memberi arahan untuk membuat perdagangan.
Pasangan mata wang GBP/USD menunjukkan volatiliti yang lebih rendah pada hari Khamis berbanding pasangan EUR/USD, yang agak mengejutkan. Pada masa yang sama, pound British pulih tanpa kesukaran untuk mencapai garis
Analisis 5-Minit pasangan EUR/USD Pasangan mata wang EUR/USD menjunam dengan ketara pada malam Khamis, namun mencatat lantunan semula tiga kali ganda lebih kuat sepanjang hari tersebut. Pergerakan pada waktu malam
Dalam ramalan pagi saya, saya memberi tumpuan pada tahap 1.3429 dan merancang untuk membuat keputusan kemasukan pasaran berdasarkan tahap tersebut. Mari kita lihat carta 5-minit dan analisis apa yang berlaku
Analisis Dagangan Hari Rabu Carta 1-Jam pasangan GBP/USD Pada hari Rabu, pasangan GBP/USD meneruskan pergerakannya menuju garis aliran menaik, dan sepanjang malam hingga ke hari Khamis, ia secara tidak dijangka
Pada hari Rabu, pasangan mata wang EUR/USD meneruskan pergerakan penurunannya, dan pada malam ke hari Khamis, ia mengalami kejatuhan mendadak. Tiada sebab yang kukuh pada hari semalam atau terutama pada
Analisis GBP/USD carta 5-Minit Pada hari Rabu, pasangan mata wang GBP/USD meneruskan pergerakan menurun yang perlahan, namun kali ini tanpa sebarang sokongan asas yang kukuh. Sebagai peringatan, pada hari Isnin
Pada hari Rabu, pasangan mata wang EUR/USD meneruskan pergerakan menurun yang sederhana, yang masih berada dalam carta aliran menaik yang berlaku. Dalam erti kata lain, kita masih mengamati satu pembetulan
Dalam ramalan pagi, saya telah mengetengahkan paras 1.3497 dan merancang untuk membuat keputusan kemasukan berdasarkan paras tersebut. Mari kita lihat carta 5 minit dan perhatikan apa yang berlaku. Kenaikan harga
Dalam ramalan pagi saya, saya menekankan tahap 1.1300 dan merancang keputusan kemasukan saya berdasarkan tahap tersebut. Mari kita lihat carta 5-minit untuk mengetahui apa yang berlaku. Penurunan dan pembentukan penembusan
Pada hari Selasa, pasangan GBP/USD juga didagangkan lebih rendah atas sebab yang sama seperti pasangan EUR/USD. Pertama, selepas perbualan dengan Ursula von der Leyen, Donald Trump menangguhkan kenaikan tarif untuk
 InstaFutures
Make money with a new promising instrument!
Video latihan

Your IP address shows that you are currently located in the USA. If you are a resident of the United States, you are prohibited from using the services of InstaFintech Group including online trading, online transfers, deposit/withdrawal of funds, etc.
If you think you are seeing this message by mistake and your location is not the US, kindly proceed to the website. Otherwise, you must leave the website in order to comply with government restrictions.
Why does your IP address show your location as the USA?
Please confirm whether you are a US resident or not by clicking the relevant button below. If you choose the wrong option, being a US resident, you will not be able to open an account with InstaTrade anyway.
We are sorry for any inconvenience caused by this message.


