Lihat juga


 24.02.2025 04:31 PM
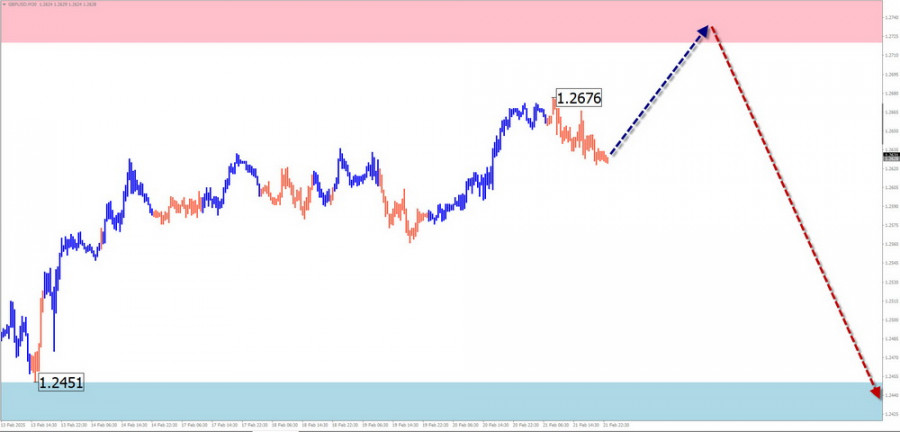
Over the past six months, GBP/USD has been following a downtrend. Since mid-January, the price has been forming a counter-wave with reversal potential from a strong support zone. The final phase of this wave is currently unfolding, nearing a major reversal area.
At the start of the week, the bullish sentiment on the pound is likely to continue, driving the price toward the resistance zone. A sideways movement and potential reversal may follow. A trend shift and price decline are expected by the end of the week.
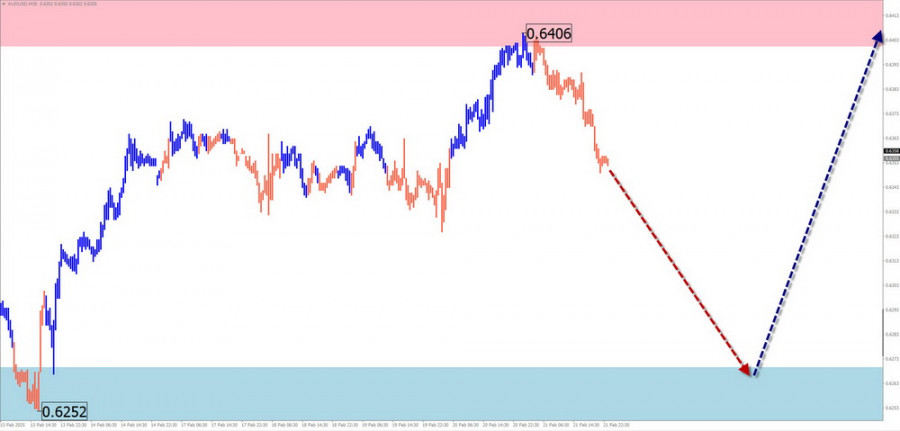
The bullish wave structure on AUD/USD, which began on February 3, has been undergoing a correction over the past 10 days. The current movement resembles a shifting flat pattern, which remains incomplete. The price has bounced off a major reversal zone on the higher timeframe.
During the first half of the week, the price is expected to decline toward the support zone, with the possibility of briefly breaking below it. Toward the end of the week, a resumption of price growth toward the resistance level is likely.
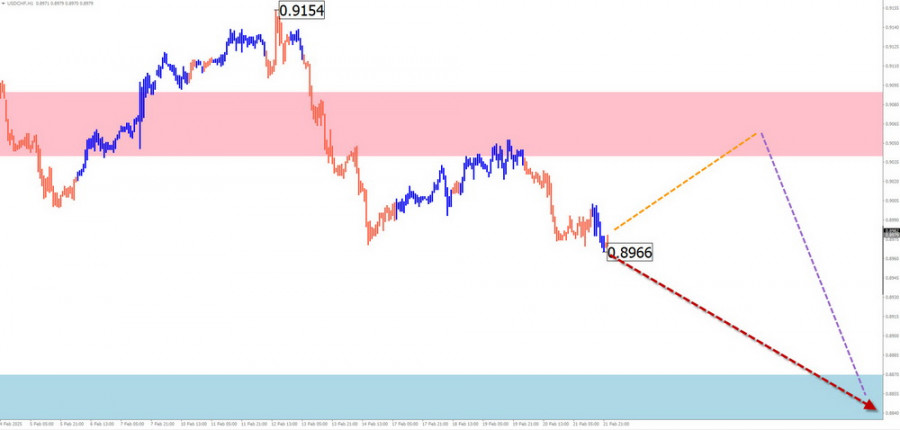
Since the beginning of the year, USD/CHF has been following a downward wave pattern, with the final phase yet to be completed. The price is now approaching a key reversal zone on the daily timeframe.
During the first half of the week, an upward movement is expected. A reversal and renewed downtrend could form near the resistance area, with a potential decline toward the end of the week.
EUR/JPY
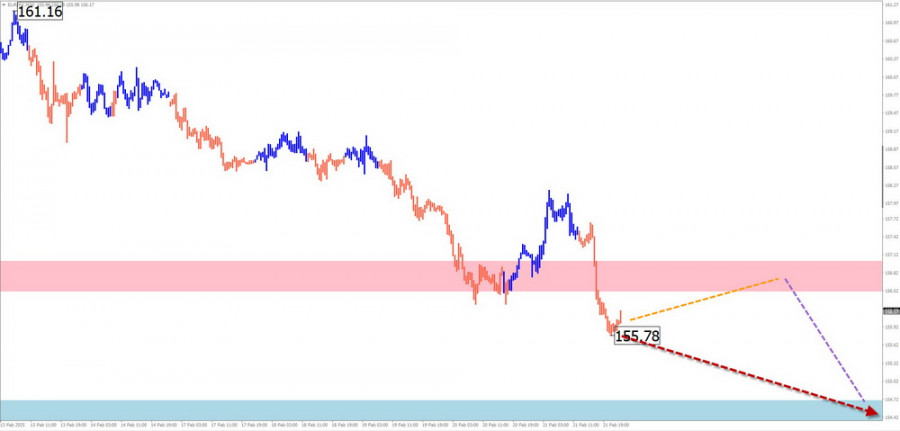
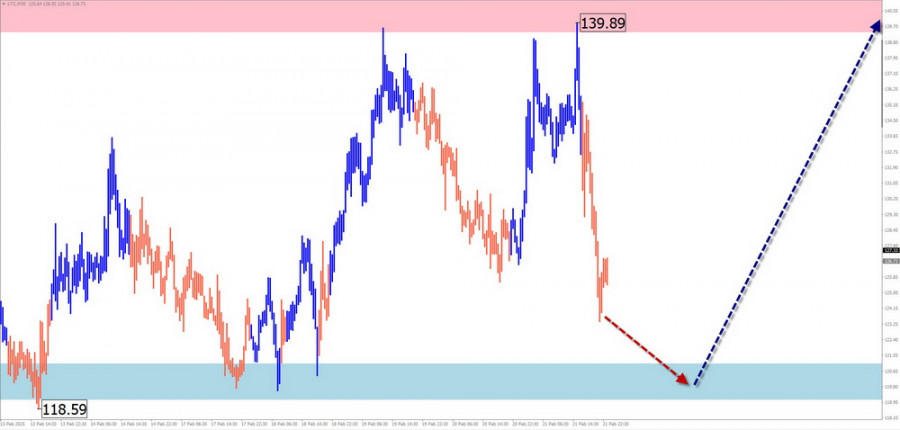
Since December, EUR/JPY has been following a downtrend. The wave is now forming its final phase (C), with the price having broken through intermediate support, which has now turned into resistance.
The pair is expected to continue its downward trajectory throughout the week. A temporary pullback toward resistance is possible early in the week, followed by a resumption of the downtrend in the second half of the week. The lower boundary of the expected price range is marked by the projected support level.
Ethereum (ETH/USD)
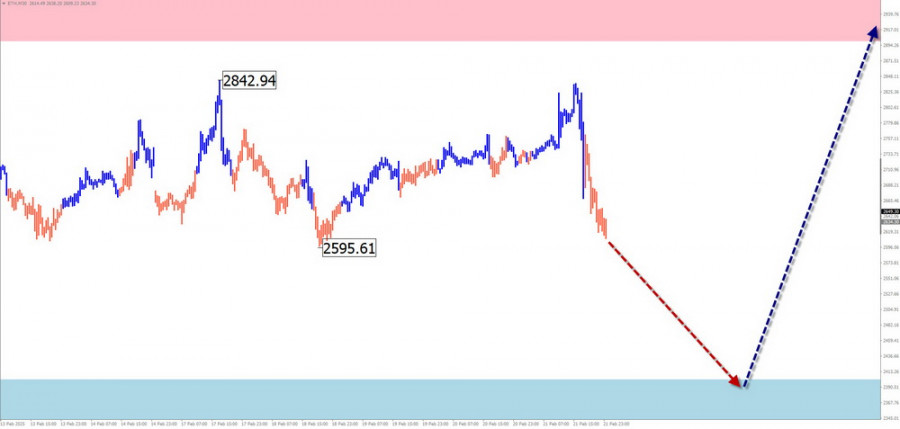
Ethereum has been forming a long-term uptrend for the past six months. Since November, it has been undergoing a prolonged correction, forming a broadening flat structure that remains incomplete. The price is now approaching a key reversal zone on a higher timeframe.
In the coming days, Ethereum is expected to continue its downward movement toward support. After testing the lower boundary, a sideways consolidation (flat market) and potential reversal could follow. A renewed bullish move is more likely by the end of the week.
Litecoin (LTC/USD)
Since early February, Litecoin has been forming an unfinished bullish wave, with the potential to become the start of a new long-term uptrend. Over the past week, the price has been undergoing a correction, forming a shifting flat structure.
During the week, sideways movement is expected within a calculated counter-trend range. A bearish movement is more likely in the first half of the week, followed by a potential reversal near support. Litecoin is expected to resume growth either by the end of the week or early next week.
Explanation of Simplified Wave Analysis (SWA):
Note: The wave algorithm does not account for time duration in market movements.
You have already liked this post today
* Analisis pasaran yang disiarkan di sini adalah bertujuan untuk meningkatkan kesedaran anda, tetapi tidak untuk memberi arahan untuk membuat perdagangan.
Struktur gelombang bagi pasangan mata wang GBP/USD kekal menunjukkan pembentukan pola gelombang impulsif menaik. Konfigurasi gelombang ini hampir sama dengan EUR/USD. Sehingga 28 Februari, pasaran telah membentuk struktur pembetulan yang
Struktur gelombang pada carta 4 jam EUR/USD telah berubah kepada konfigurasi kenaikan dan terus bergerak mengikut trajektori tersebut. Tidak banyak keraguan bahawa transformasi ini dipacu sepenuhnya oleh dasar perdagangan baharu
Struktur gelombang untuk GBP/USD terus menunjukkan pembentukan corak gelombang impulsif yang meningkat. Susunan gelombang hampir sama dengan EUR/USD. Sehingga 28 Februari, kami menyaksikan perkembangan struktur pembetulan yang meyakinkan yang meninggalkan
Struktur gelombang untuk GBP/USD terus menunjukkan perkembangan corak gelombang impuls menaik. Imej gelombang ini menyerupai EUR/USD. Sehingga 28 Februari, kami melihat pembentukan struktur pembetulan yang meyakinkan yang tidak menimbulkan keraguan
GBP/USD Analisis: Sejak Januari, pound British menunjukkan aliran menaik. Segmen semasa yang belum selesai bermula pada 8 April. Dalam gelombang ini, segmen akhir belum tamat. Harga telah memecah zon rintangan
EUR/USD Analisis: Sejak April, pasangan utama euro telah membentuk pennant mendatar turun. Dari zon pembalikan berpotensi yang kuat pada carta masa harian pertengahan Mei, harga mula meningkat, membentuk gelombang pembetulan
Bagi pasangan GBP/USD, struktur gelombang terus menunjukkan perkembangan arah aliran impulsif bullish. Corak gelombang ini hampir serupa dengan EUR/USD. Sehingga 28 Februari, kita telah menyaksikan pembentukan struktur pembetulan yang jelas
Ferrari F8 TRIBUTO
dari InstaTrade
E-mel/SMS
pemberitahuan

Your IP address shows that you are currently located in the USA. If you are a resident of the United States, you are prohibited from using the services of InstaFintech Group including online trading, online transfers, deposit/withdrawal of funds, etc.
If you think you are seeing this message by mistake and your location is not the US, kindly proceed to the website. Otherwise, you must leave the website in order to comply with government restrictions.
Why does your IP address show your location as the USA?
Please confirm whether you are a US resident or not by clicking the relevant button below. If you choose the wrong option, being a US resident, you will not be able to open an account with InstaTrade anyway.
We are sorry for any inconvenience caused by this message.

