Corak sebenar

Double Top
was formed on 21.03 at 22:00:07 (UTC+0)
signal strength 2 of 5
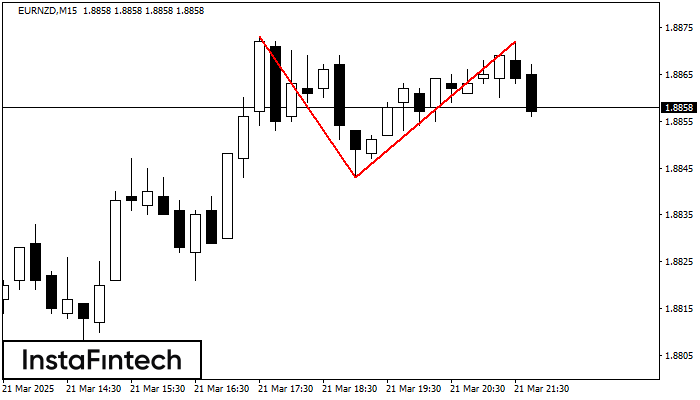
The Double Top reversal pattern has been formed on EURNZD M15. Characteristics: the upper boundary 1.8873; the lower boundary 1.8843; the width of the pattern is 29 points. Sell trades are better to be opened below the lower boundary 1.8843 with a possible movements towards the 1.8821 level.
The M5 and M15 time frames may have more false entry points.
Juga lihat
- All
- All
- Bearish Rectangle
- Bearish Symmetrical Triangle
- Bearish Symmetrical Triangle
- Bullish Rectangle
- Double Top
- Double Top
- Triple Bottom
- Triple Bottom
- Triple Top
- Triple Top
- All
- All
- Buy
- Sale
- All
- 1
- 2
- 3
- 4
- 5
Bullish Rectangle
was formed on 17.04 at 21:47:00 (UTC+0)
signal strength 2 of 5
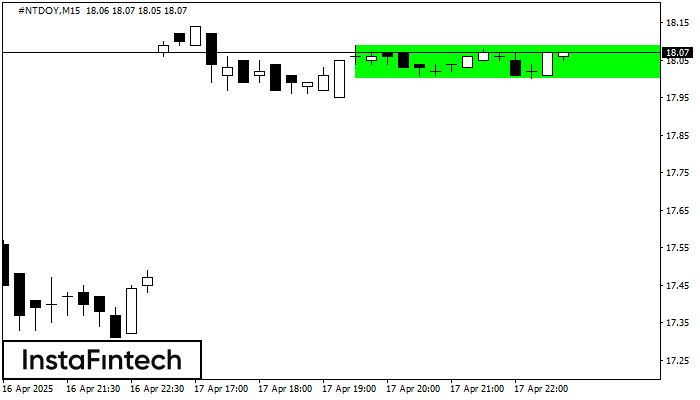
According to the chart of M15, #NTDOY formed the Bullish Rectangle. The pattern indicates a trend continuation. The upper border is 18.09, the lower border is 18.00. The signal means
The M5 and M15 time frames may have more false entry points.
Open chart in a new window
Bullish Rectangle
was formed on 17.04 at 21:45:00 (UTC+0)
signal strength 1 of 5
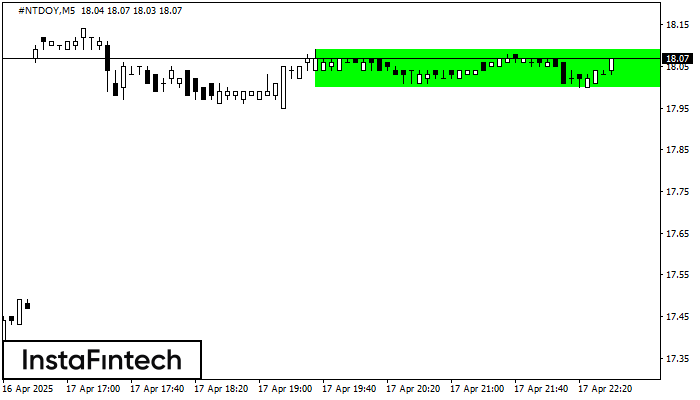
According to the chart of M5, #NTDOY formed the Bullish Rectangle. The pattern indicates a trend continuation. The upper border is 18.09, the lower border is 18.00. The signal means
The M5 and M15 time frames may have more false entry points.
Open chart in a new window
Bearish Symmetrical Triangle
was formed on 17.04 at 21:00:18 (UTC+0)
signal strength 2 of 5
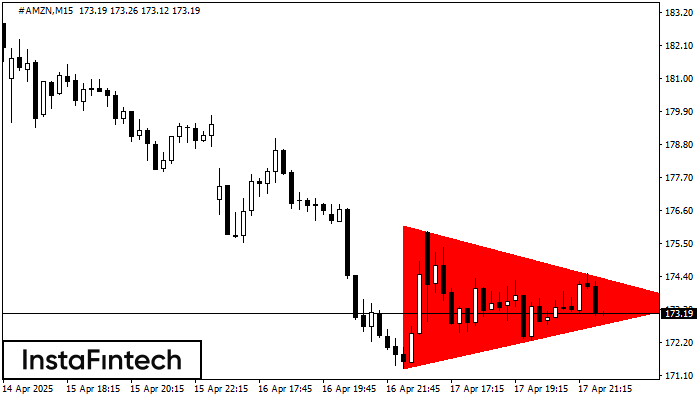
According to the chart of M15, #AMZN formed the Bearish Symmetrical Triangle pattern. Trading recommendations: A breach of the lower border 171.36 is likely to encourage a continuation
The M5 and M15 time frames may have more false entry points.
Open chart in a new window