Corak sebenar

Bullish Symmetrical Triangle
was formed on 16.04 at 16:58:03 (UTC+0)
signal strength 2 of 5
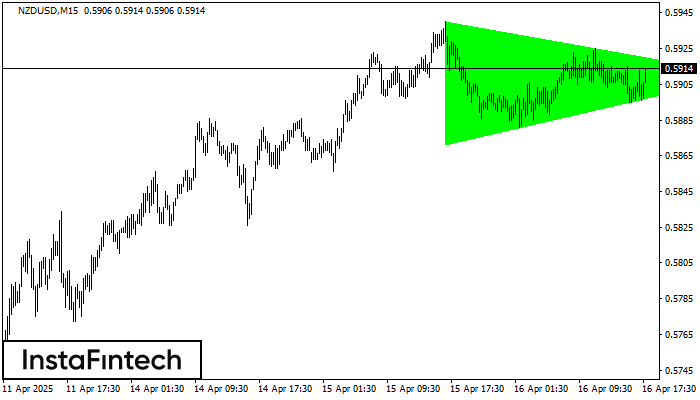
According to the chart of M15, NZDUSD formed the Bullish Symmetrical Triangle pattern. Description: This is the pattern of a trend continuation. 0.5940 and 0.5872 are the coordinates of the upper and lower borders respectively. The pattern width is measured on the chart at 68 pips. Outlook: If the upper border 0.5940 is broken, the price is likely to continue its move by 0.5932.
The M5 and M15 time frames may have more false entry points.
- All
- All
- Bearish Rectangle
- Bearish Symmetrical Triangle
- Bearish Symmetrical Triangle
- Bullish Rectangle
- Double Top
- Double Top
- Triple Bottom
- Triple Bottom
- Triple Top
- Triple Top
- All
- All
- Buy
- Sale
- All
- 1
- 2
- 3
- 4
- 5
Head dan Shoulders
was formed on 29.05 at 09:45:24 (UTC+0)
signal strength 1 of 5
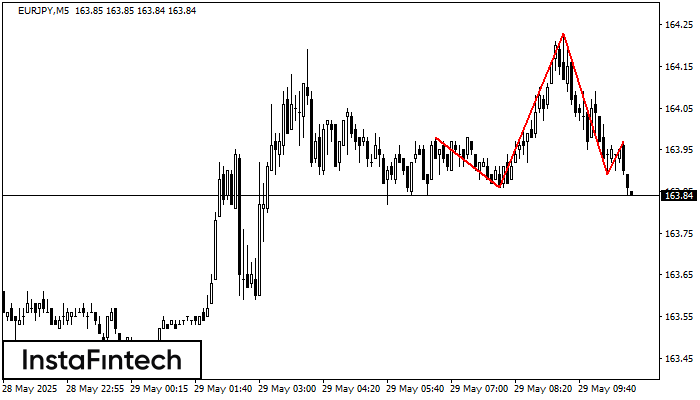
Berdasarkan M5, EURJPY membentuk corak Head dan Shoulders. Bahagian atas Head ditetapkan pada 164.23 manakala garisan median Neck akan ditetapkan pada 163.86/163.89. Pembentukan corak Head dan Shoulders jelas menandakan pembalikan
Carta masa M5 dan M15 mungkin mempunyai lebih banyak titik kemasukan palsu.
Open chart in a new window
Double Top
was formed on 29.05 at 09:30:03 (UTC+0)
signal strength 3 of 5
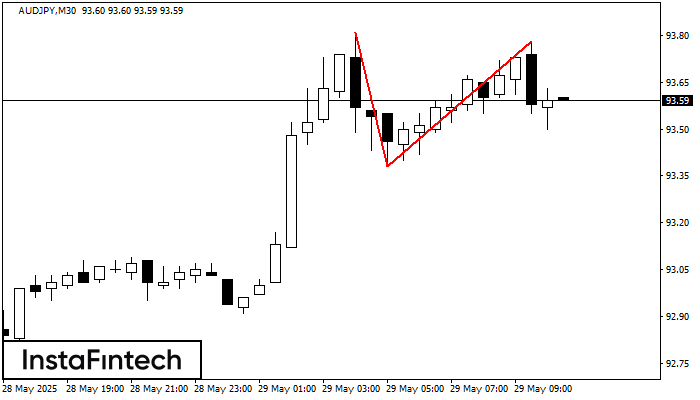
Corak Double Top telah dibentuk pada AUDJPY M30. Isyarat bahawa aliran telah berubah dari aliran menaik ke aliran menurun. Mungkin, sekiranya asas corak 93.38 ditembusi, pergerakan menurun akan berterusan
Open chart in a new window
Double Top
was formed on 29.05 at 09:15:11 (UTC+0)
signal strength 2 of 5
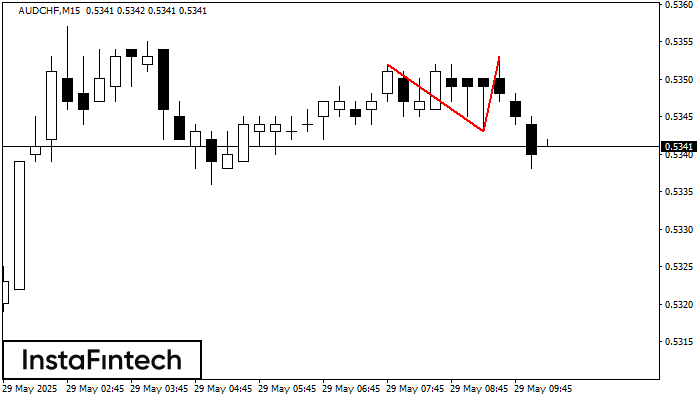
Corak Double Top telah dibentuk pada AUDCHF M15. Isyarat bahawa aliran telah berubah dari aliran menaik ke aliran menurun. Mungkin, sekiranya asas corak 0.5343 ditembusi, pergerakan menurun akan berterusan
Carta masa M5 dan M15 mungkin mempunyai lebih banyak titik kemasukan palsu.
Open chart in a new window