Corak sebenar

Triple Bottom
was formed on 17.04 at 02:00:03 (UTC+0)
signal strength 1 of 5
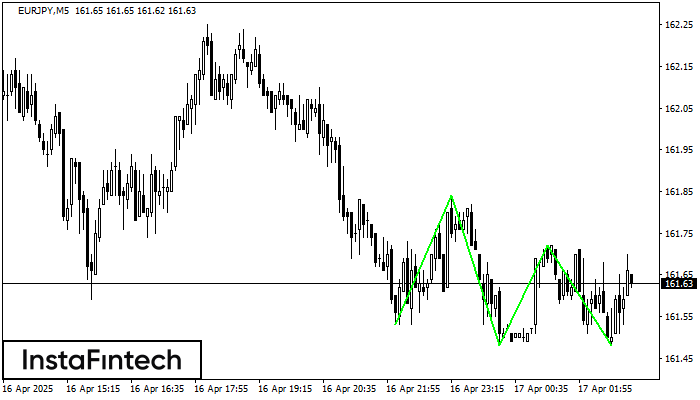
The Triple Bottom pattern has been formed on EURJPY M5. It has the following characteristics: resistance level 161.84/161.72; support level 161.53/161.48; the width is 31 points. In the event of a breakdown of the resistance level of 161.84, the price is likely to continue an upward movement at least to 161.63.
The M5 and M15 time frames may have more false entry points.
- All
- All
- Bearish Rectangle
- Bearish Symmetrical Triangle
- Bearish Symmetrical Triangle
- Bullish Rectangle
- Double Top
- Double Top
- Triple Bottom
- Triple Bottom
- Triple Top
- Triple Top
- All
- All
- Buy
- Sale
- All
- 1
- 2
- 3
- 4
- 5
Bendera Bullish
was formed on 29.05 at 01:05:37 (UTC+0)
signal strength 1 of 5
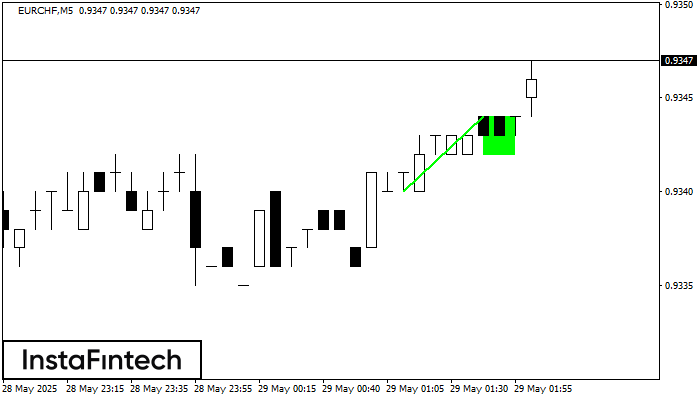
Pola Bendera Bullish telah terbentuk di grafik EURCHF M5, yang memberikan sinyal tren naik akan berlanjut. Sinyal: penembusan titik puncak di 0.9344 mungkin mendorong harga lebih tinggi, dan kenaikan akan
Rangka waktu M5 dan M15 mungkin memiliki lebih dari titik entri yang keliru.
Open chart in a new window
Persegi Bearish
was formed on 29.05 at 01:02:33 (UTC+0)
signal strength 2 of 5
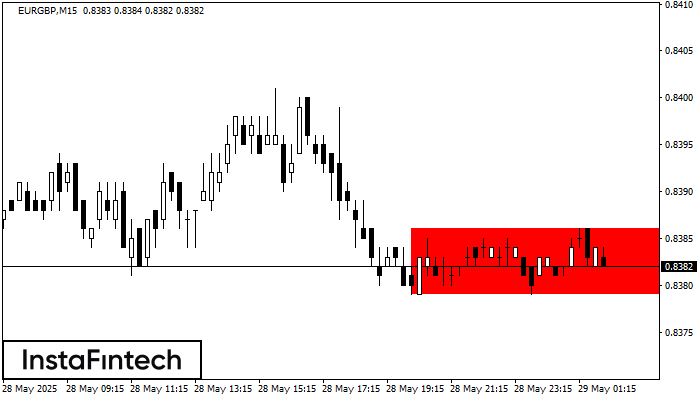
Menurut grafik dari M15, EURGBP terbentuk Persegi Bearish. Jenis pola ini menunjukkan kelanjutan tren. Terdiri dari dua tingkat: resistance 0.8386 - 0.0000 dan support 0.8379 – 0.8379. Jika level resistance
Rangka waktu M5 dan M15 mungkin memiliki lebih dari titik entri yang keliru.
Open chart in a new window
Bawah Ganda
was formed on 29.05 at 00:31:19 (UTC+0)
signal strength 3 of 5
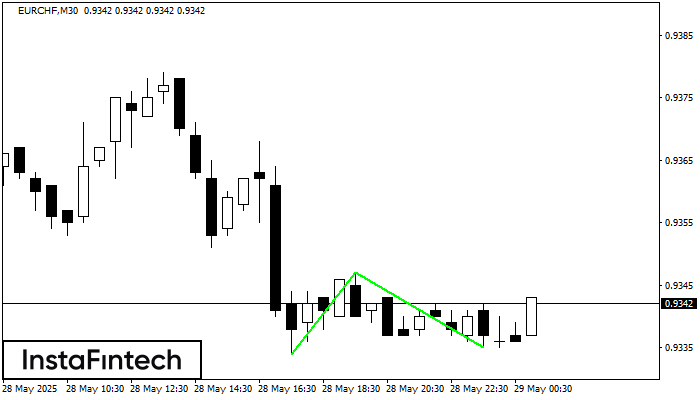
Pola Bawah Ganda telah terbentuk pada EURCHF M30; batas atas di 0.9347; batas bawah di 0.9335. Lebar pola sebesar 13 poin. Jika harga menembus batas atas 0.9347, Perubahan dalam tren
Open chart in a new window