

Corak sebenar

Bullish Symmetrical Triangle
was formed on 17.04 at 03:06:49 (UTC+0)
signal strength 3 of 5

According to the chart of M30, EURNZD formed the Bullish Symmetrical Triangle pattern. Description: This is the pattern of a trend continuation. 1.9252 and 1.9161 are the coordinates of the upper and lower borders respectively. The pattern width is measured on the chart at 91 pips. Outlook: If the upper border 1.9252 is broken, the price is likely to continue its move by 1.9237.
- All
- All
- Bearish Rectangle
- Bearish Symmetrical Triangle
- Bearish Symmetrical Triangle
- Bullish Rectangle
- Double Top
- Double Top
- Triple Bottom
- Triple Bottom
- Triple Top
- Triple Top
- All
- All
- Buy
- Sale
- All
- 1
- 2
- 3
- 4
- 5
Double Top
was formed on 29.05 at 19:30:15 (UTC+0)
signal strength 2 of 5
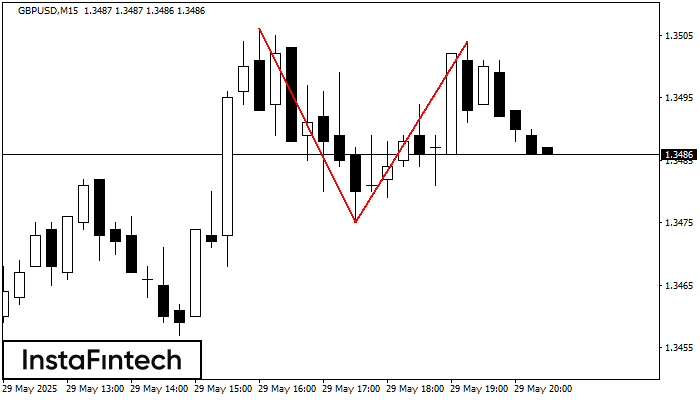
The Double Top reversal pattern has been formed on GBPUSD M15. Characteristics: the upper boundary 1.3506; the lower boundary 1.3475; the width of the pattern is 29 points. Sell trades
The M5 and M15 time frames may have more false entry points.
Open chart in a new window
Triple Bottom
was formed on 29.05 at 19:25:15 (UTC+0)
signal strength 1 of 5
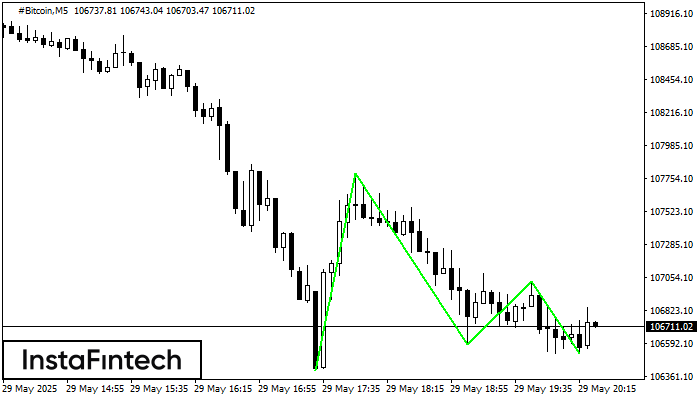
The Triple Bottom pattern has formed on the chart of #Bitcoin M5. Features of the pattern: The lower line of the pattern has coordinates 107787.17 with the upper limit 107787.17/107030.78
The M5 and M15 time frames may have more false entry points.
Open chart in a new window
Triple Top
was formed on 29.05 at 19:25:14 (UTC+0)
signal strength 1 of 5
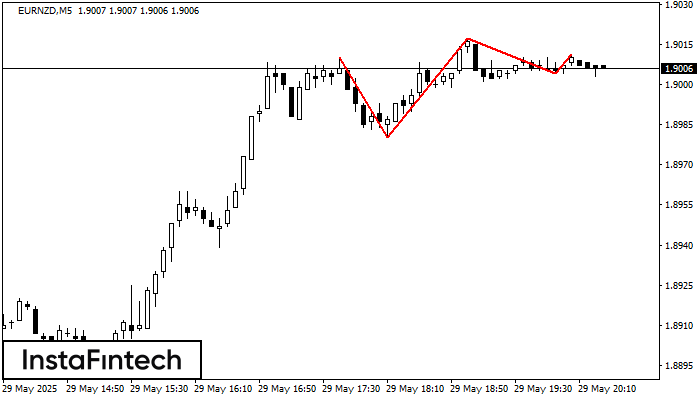
The Triple Top pattern has formed on the chart of the EURNZD M5 trading instrument. It is a reversal pattern featuring the following characteristics: resistance level -1, support level -24
The M5 and M15 time frames may have more false entry points.
Open chart in a new window


