Corak sebenar

Double Bottom
was formed on 17.04 at 15:29:57 (UTC+0)
signal strength 2 of 5

The Double Bottom pattern has been formed on #EBAY M15; the upper boundary is 67.35; the lower boundary is 65.16. The width of the pattern is 215 points. In case of a break of the upper boundary 67.35, a change in the trend can be predicted where the width of the pattern will coincide with the distance to a possible take profit level.
The M5 and M15 time frames may have more false entry points.
- All
- All
- Bearish Rectangle
- Bearish Symmetrical Triangle
- Bearish Symmetrical Triangle
- Bullish Rectangle
- Double Top
- Double Top
- Triple Bottom
- Triple Bottom
- Triple Top
- Triple Top
- All
- All
- Buy
- Sale
- All
- 1
- 2
- 3
- 4
- 5
Retângulo de alta
was formed on 30.04 at 10:57:58 (UTC+0)
signal strength 1 of 5
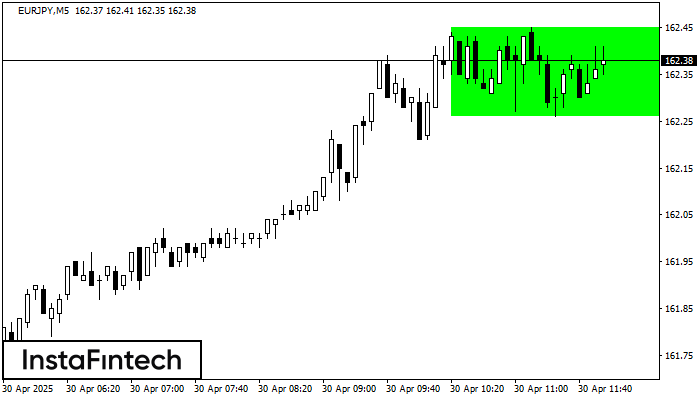
Conforme o gráfico de M5, EURJPY formou o Retângulo de alta. Este tipo de padrão indica uma continuação da tendência. Ele consiste em dois níveis: resistência 162.45 e suporte 162.26
Os intervalos M5 e M15 podem ter mais pontos de entrada falsos.
Open chart in a new window
Topo triplo
was formed on 30.04 at 10:25:27 (UTC+0)
signal strength 1 of 5
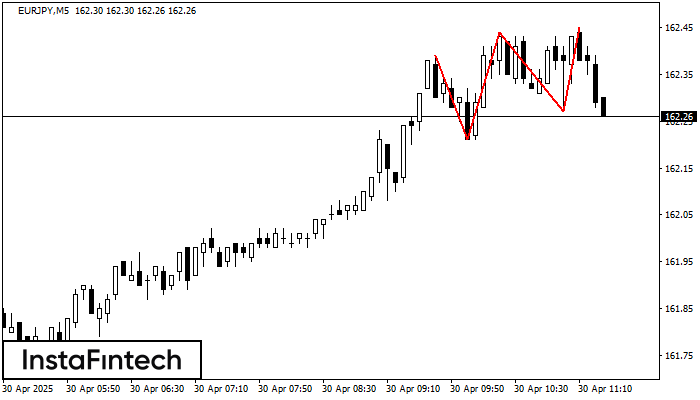
O padrão Topo triplo foi formado no gráfico do instrumento de negociação EURJPY M5. É um padrão de reversão com as seguintes características: nível de resistência -6, nível de suporte
Os intervalos M5 e M15 podem ter mais pontos de entrada falsos.
Open chart in a new window
Retângulo de baixa
was formed on 30.04 at 10:08:30 (UTC+0)
signal strength 2 of 5
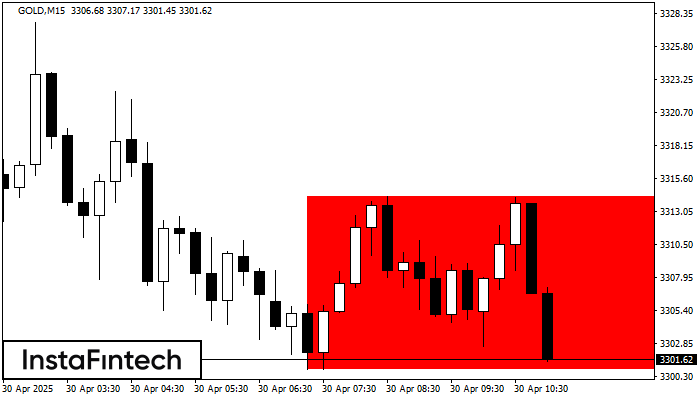
De acordo com o gráfico de M15, GOLD formou Retângulo de baixa. O padrão indica uma continuação da tendência. O limite superior é 3314.24, o limite inferior é 3300.82
Os intervalos M5 e M15 podem ter mais pontos de entrada falsos.
Open chart in a new window