Corak sebenar

Double Bottom
was formed on 17.04 at 18:00:01 (UTC+0)
signal strength 1 of 5
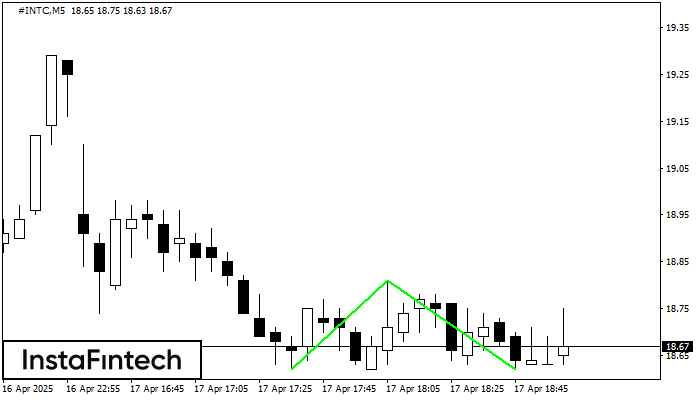
The Double Bottom pattern has been formed on #INTC M5; the upper boundary is 18.81; the lower boundary is 18.62. The width of the pattern is 19 points. In case of a break of the upper boundary 18.81, a change in the trend can be predicted where the width of the pattern will coincide with the distance to a possible take profit level.
The M5 and M15 time frames may have more false entry points.
Juga lihat
- All
- All
- Bearish Rectangle
- Bearish Symmetrical Triangle
- Bearish Symmetrical Triangle
- Bullish Rectangle
- Double Top
- Double Top
- Triple Bottom
- Triple Bottom
- Triple Top
- Triple Top
- All
- All
- Buy
- Sale
- All
- 1
- 2
- 3
- 4
- 5
Inverse Head and Shoulder
was formed on 28.05 at 21:45:23 (UTC+0)
signal strength 1 of 5
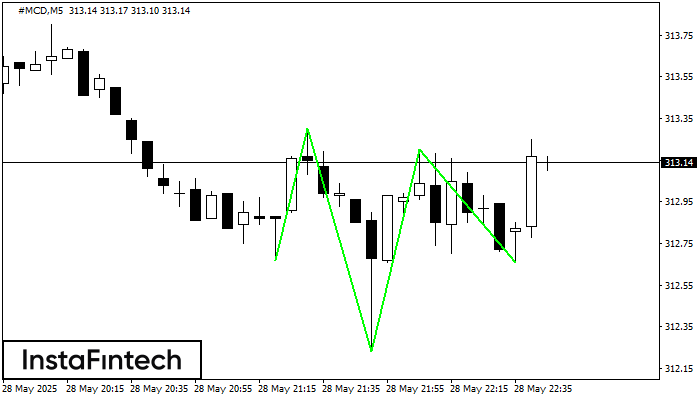
According to M5, #MCD is shaping the technical pattern – the Inverse Head and Shoulder. In case the Neckline 313.30/313.20 is broken out, the instrument is likely to move toward
The M5 and M15 time frames may have more false entry points.
Open chart in a new window
Bearish Rectangle
was formed on 28.05 at 21:37:34 (UTC+0)
signal strength 1 of 5
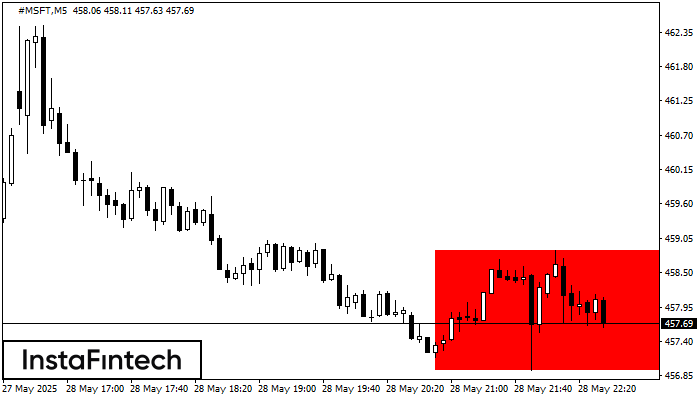
According to the chart of M5, #MSFT formed the Bearish Rectangle which is a pattern of a trend continuation. The pattern is contained within the following borders: lower border 456.94
The M5 and M15 time frames may have more false entry points.
Open chart in a new window
Double Bottom
was formed on 28.05 at 21:30:27 (UTC+0)
signal strength 2 of 5
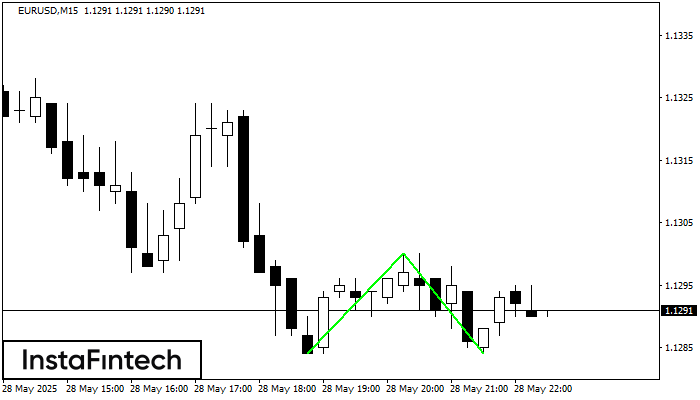
The Double Bottom pattern has been formed on EURUSD M15. This formation signals a reversal of the trend from downwards to upwards. The signal is that a buy trade should
The M5 and M15 time frames may have more false entry points.
Open chart in a new window