

Corak sebenar

Bullish Symmetrical Triangle
was formed on 17.04 at 19:29:11 (UTC+0)
signal strength 1 of 5
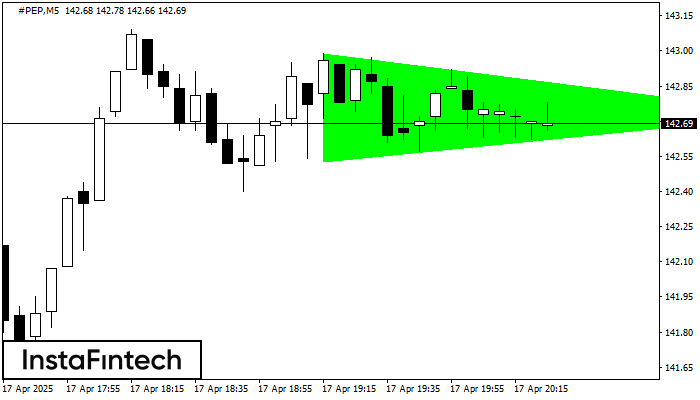
According to the chart of M5, #PEP formed the Bullish Symmetrical Triangle pattern. The lower border of the pattern touches the coordinates 142.53/142.73 whereas the upper border goes across 142.99/142.73. If the Bullish Symmetrical Triangle pattern is in progress, this evidently signals a further upward trend. In other words, in case the scenario comes true, the price of #PEP will breach the upper border to head for 142.88.
The M5 and M15 time frames may have more false entry points.
- All
- All
- Bearish Rectangle
- Bearish Symmetrical Triangle
- Bearish Symmetrical Triangle
- Bullish Rectangle
- Double Top
- Double Top
- Triple Bottom
- Triple Bottom
- Triple Top
- Triple Top
- All
- All
- Buy
- Sale
- All
- 1
- 2
- 3
- 4
- 5
Double Bottom
was formed on 30.05 at 07:00:36 (UTC+0)
signal strength 1 of 5
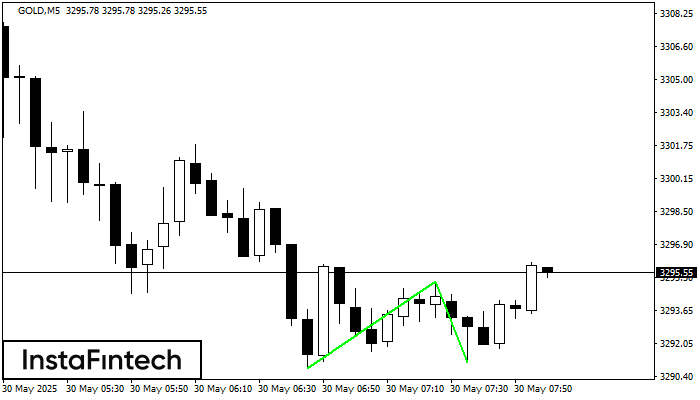
The Double Bottom pattern has been formed on GOLD M5. Characteristics: the support level 3290.81; the resistance level 3295.09; the width of the pattern 428 points. If the resistance level
The M5 and M15 time frames may have more false entry points.
Open chart in a new window
Double Bottom
was formed on 30.05 at 07:00:19 (UTC+0)
signal strength 2 of 5
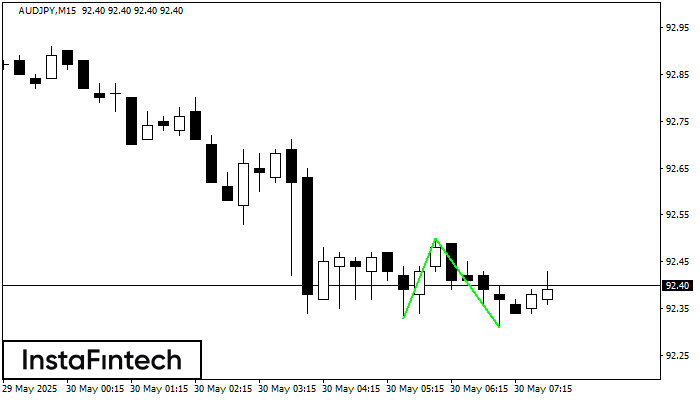
The Double Bottom pattern has been formed on AUDJPY M15; the upper boundary is 92.50; the lower boundary is 92.31. The width of the pattern is 17 points. In case
The M5 and M15 time frames may have more false entry points.
Open chart in a new window
Bullish Rectangle
was formed on 30.05 at 06:39:56 (UTC+0)
signal strength 3 of 5
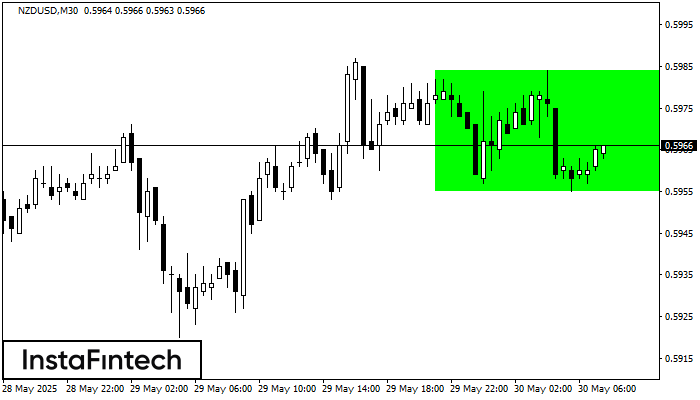
According to the chart of M30, NZDUSD formed the Bullish Rectangle which is a pattern of a trend continuation. The pattern is contained within the following borders: the lower border
Open chart in a new window


