Corak sebenar

Triple Top
was formed on 17.04 at 23:00:24 (UTC+0)
signal strength 2 of 5
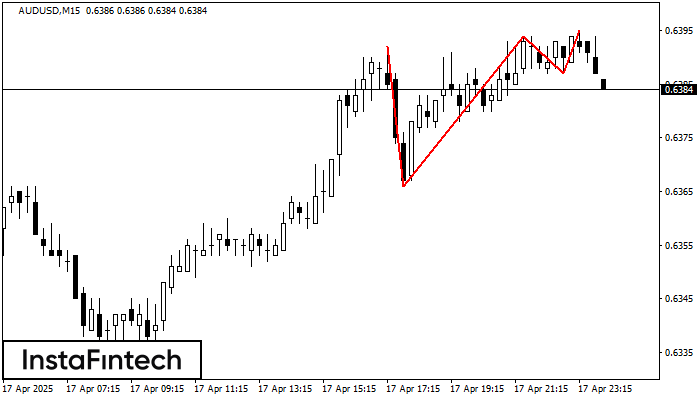
The Triple Top pattern has formed on the chart of the AUDUSD M15 trading instrument. It is a reversal pattern featuring the following characteristics: resistance level -3, support level -21, and pattern’s width 26. Forecast If the price breaks through the support level 0.6366, it is likely to move further down to 0.6371.
The M5 and M15 time frames may have more false entry points.
- All
- All
- Bearish Rectangle
- Bearish Symmetrical Triangle
- Bearish Symmetrical Triangle
- Bullish Rectangle
- Double Top
- Double Top
- Triple Bottom
- Triple Bottom
- Triple Top
- Triple Top
- All
- All
- Buy
- Sale
- All
- 1
- 2
- 3
- 4
- 5
Bearish Symmetrical Triangle
was formed on 30.04 at 06:15:48 (UTC+0)
signal strength 1 of 5

According to the chart of M5, USDCHF formed the Bearish Symmetrical Triangle pattern. This pattern signals a further downward trend in case the lower border 0.8226 is breached. Here
The M5 and M15 time frames may have more false entry points.
Open chart in a new window
Triple Bottom
was formed on 30.04 at 05:45:24 (UTC+0)
signal strength 1 of 5

The Triple Bottom pattern has formed on the chart of GBPAUD M5. Features of the pattern: The lower line of the pattern has coordinates 2.0938 with the upper limit 2.0938/2.0931
The M5 and M15 time frames may have more false entry points.
Open chart in a new window
Bearish pennant
was formed on 30.04 at 05:22:56 (UTC+0)
signal strength 2 of 5

The Bearish pennant pattern has formed on the GBPAUD M15 chart. It signals potential continuation of the existing trend. Specifications: the pattern’s bottom has the coordinate of 2.0901; the projection
The M5 and M15 time frames may have more false entry points.
Open chart in a new window